
Georgia, Inland Waterways, National Category
Startup Uses Drone for Cleaning Water, Collecting Data


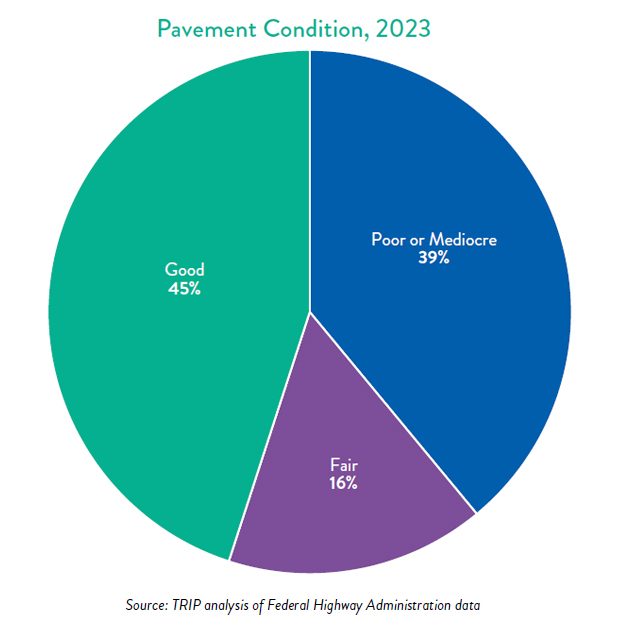
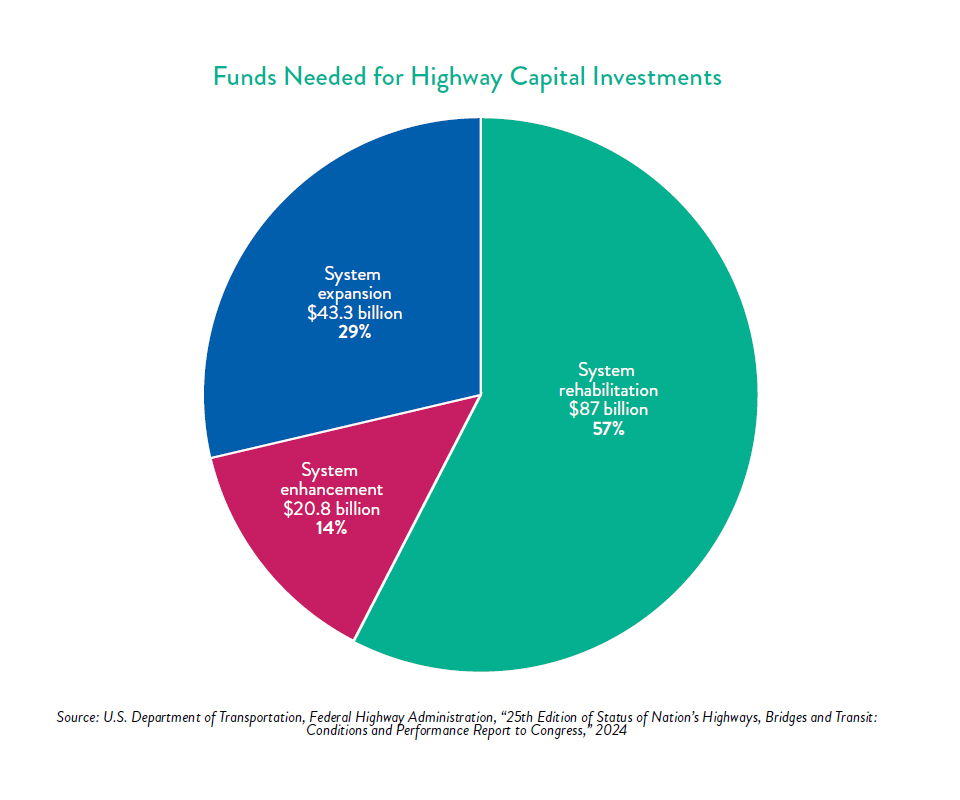
Roads connect communities and play a vital role in the nation’s economy. Although Americans’ travel patterns have shifted in the years following the COVID-19 pandemic, vehicle miles traveled (VMT) have rebounded. Some 39% of major roads in the U.S. are in poor or mediocre condition, an improvement from the 43% recorded in 2020. Driving on deteriorated and congested roads still costs the average driver over $1,400 per year in vehicle operating costs and lost time. While once again declining, the number of people dying on America’s roads remains high, totaling 40,990 in 2023. Furthermore, the impacts of extreme weather events present challenges for maintaining existing roads and planning future projects. Recent investments, including more than $591 billion since late 2021 from the Infrastructure Investment and Jobs Act (IIJA), are a positive step. The nation’s roadways still face a $684 billion funding gap over the next 10 years. Sustained and robust infrastructure investment is needed to maintain and improve the roadway network for the future.
lost 43 hours to traffic congestion
in 2024
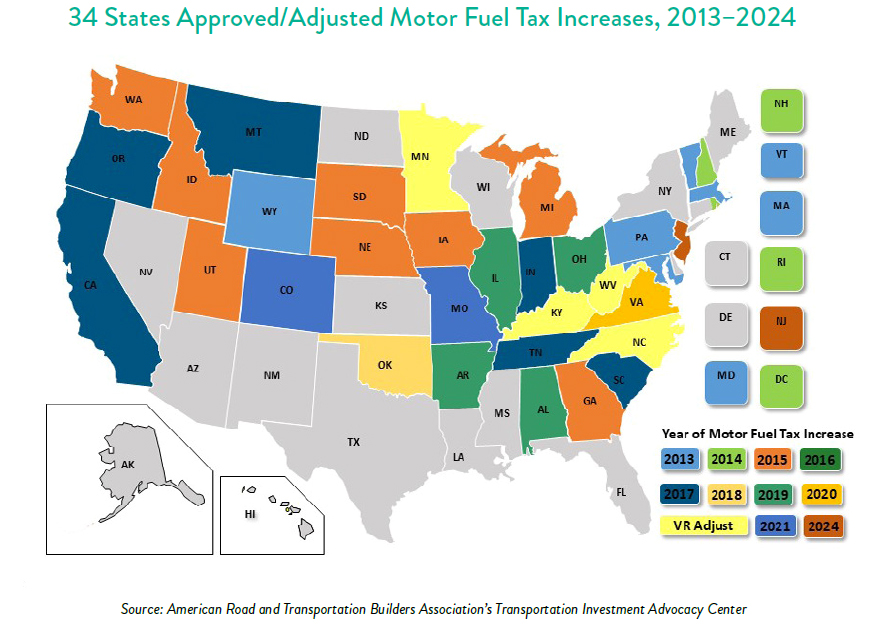
80% of its purchasing power
since it was last raised in 1993
occur in rural areas, where only 19%
of the U.S. population lives
The nation’s roads have had to accommodate increased vehicle travel and a growing population in recent years. Roads with the highest speeds and the highest volumes of traffic are generally prioritized for funding and therefore are typically in the best condition. Based on miles, the share of pavements on roads eligible for federal funding with good ride quality improved between 2008 and 2018, rising from 40.7% to 47.2%. However, the share of federal-aid highway pavements with poor ride quality also grew during this period, increasing from 15.8% to 22.6%. Deteriorated roads result in additional operating costs in the form of vehicle repairs and tire wear. Additional vehicle operating costs totaled $725 per motorist in 2023.

The IIJA contained a five-year reauthorization of federal surface transportation programs for Fiscal Years 2022 through 2026, including $273.2 billion over five years in formula funding for states through the federal-aid highway program. The IIJA represented a nearly 50% increase in highway funding from the previous surface transportation reauthorization. Since the law’s enactment, construction work has started on 207,000 miles of roadways.

Government agencies and private sector entities work together to operate and maintain the nation’s transportation system. Each state is required by federal law to develop a risk-based asset management plan for the National Highway System to improve or preserve system condition and performance. Achieving and maintaining a state of good repair on existing roadways is essential. Life-cycle cost analysis, which helps provide awareness of total infrastructure cost, can help transportation professionals and elected officials make well-informed Operation and Maintenance decisions.

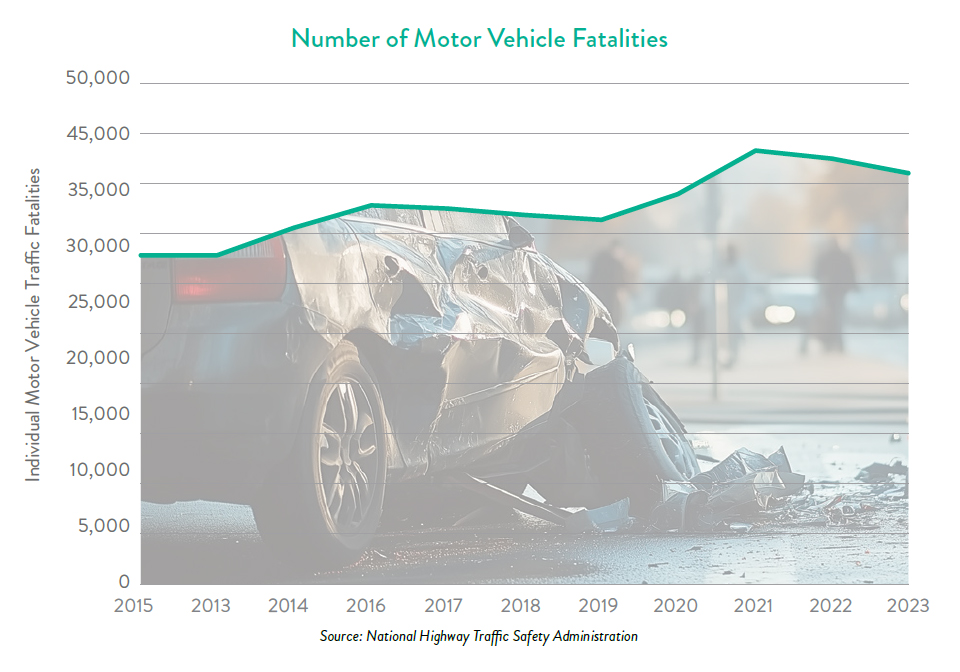
Safety remains a significant issue on the nation’s roadways. The National Highway Traffic Safety Administration (NHTSA) estimates 40,990 people died in motor vehicle traffic crashes in 2023, an average of 112 deaths per day. The amount of people dying on America’s roadways per year is equal to four airplanes full of passengers crashing every week.
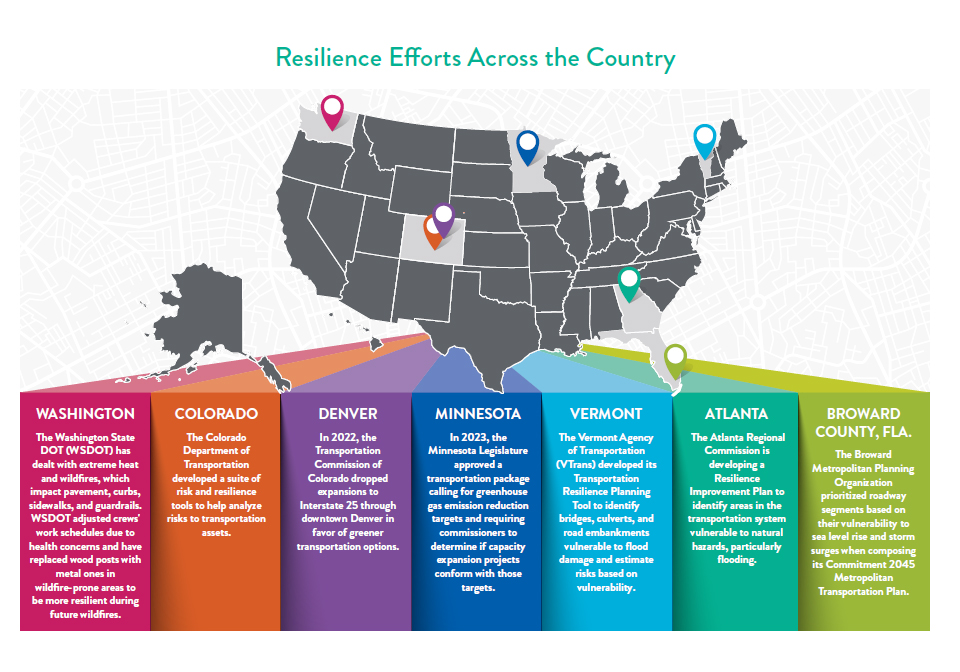
Among the most pressing challenges for roads are the impacts of extreme weather, which the transportation sector itself exacerbates. Transportation accounted for the most significant portion (28%) of total U.S. greenhouse gas emissions in 2022. Most of these emissions (80%) came from cars and medium- and heavy-duty trucks. Rising temperatures, fires, flooding, erosion, and severe weather strain the nation’s roadways. In addition to planning and building resiliently for the future, state departments of transportation (DOTs) need to ensure their existing infrastructure can support daily operations and facilitate the movement of people evacuating areas affected by extreme weather events. Evacuations are necessary to move people out of harm’s way; however, they can stress transportation networks, snarl traffic, and present safety concerns. One particularly fraught example is the evacuation preceding Hurricane Rita, which hit less than a month after Hurricane Katrina and forced an estimated 3.7 million people to evacuate the Houston area. The evacuation resulted in more than 100 deaths. In contrast, the Caldor Fire in the summer of 2021 required an organized evacuation of more than 50,000 residents from California to Nevada and did not result in any fatalities.


Solutions that Work
![]()
The indicator for pavement ride quality is the International Roughness Index, which measures the cumulative deviation from a smooth surface in inches per mile.35 The FHWA has found that a road surface with an International Roughness Index (IRI) rating below 95 provides good ride quality, a road with an IRI from 95 to 170 provides fair ride quality, and a road with an IRI above 170 provides poor ride quality.
Photo Attributions

Select your home state, and we'll let you know about upcoming legislation.
"*" indicates required fields