
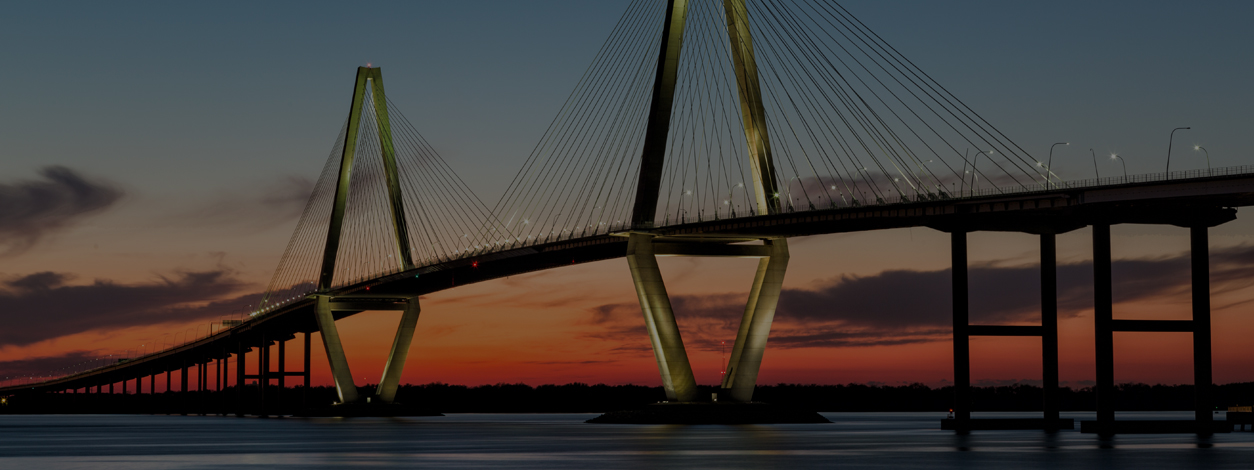

2026 Report Card for South Carolina’s Infrastructure
Infrastructure is the backbone of South Carolina’s economy, public health, and quality of life. When infrastructure fails to keep pace with growth, the costs fall on residents and communities across the state through reduced safety, diminished quality of life, and slower economic development. South Carolina’s overall infrastructure GPA improved from a D+ in 2021 to a C- in 2026, reflecting progress driven largely by state and federal investment. However, a C- still indicates infrastructure in mediocre condition that requires continued attention. Seven of the eight graded categories remain in the D or C range, and both Drinking Water and Bridges declined since 2021.
The Infrastructure Investment and Jobs Act (IIJA) delivered significant federal funding to South Carolina. This included more than $182 million for drinking water systems, a historic $80 million state investment in aviation, and growth in the state’s highway program from $1 billion in 2009 to $6.2 billion in 2024. Charleston Harbor was deepened to 52 feet, making it the deepest port on the East Coast. Safety metrics also improved, with traffic fatality rates declining from 2.1 to 1.7 per 100 million vehicle miles traveled, dam safety staffing increasing fourfold, and aviation modernization through NextGen technologies improving aircraft sequencing.
The passage of the South Carolina Department of Transportation Modernization Act (S.831) in 2026 demonstrates the state’s commitment to future infrastructure investment. Although enacted after the Report Card’s data collection period and therefore not reflected in the grades, the legislation elevates transportation leadership to a cabinet-level position, streamlines environmental permitting, expands public-private partnership opportunities, and establishes faster repair timelines. These reforms are intended to improve project delivery and encourage additional investment.
Despite recent gains, important challenges remain. Federal IIJA funding is temporary, and future funding sources are uncertain. South Carolina continues to rank among the top three states for traffic fatalities per 100,000 vehicle miles traveled. Roads, drinking water, and wastewater infrastructure face annual funding gaps measured in hundreds of millions of dollars. Without a sustained state-level funding strategy, recent progress could stall or reverse.
South Carolina is at a crossroads. The state’s population of approximately 5.6 million people is projected to exceed 6.2 million by 2035, increasing demands on infrastructure systems. Climate change compounds these challenges. Sea levels along the South Carolina coast have risen about 10 inches since 1950 and continue to rise at an accelerating rate. By mid-century, 76 critical infrastructure assets are expected to experience regular tidal flooding. Hurricane Helene exposed resilience weaknesses in drinking water systems across the state, while eleven federal disaster declarations between 2022 and 2025 underscore growing pressures from extreme weather.
Workforce and innovation challenges are also emerging. Drinking water and wastewater utilities, particularly in smaller communities, are struggling to attract and retain qualified operators. New initiatives such as the South Carolina Office of Resilience and the state’s first Bus Rapid Transit project represent positive steps, but long-term success will require continued workforce development and data-driven infrastructure management. South Carolina’s C- grade reflects progress, but it should be considered a baseline rather than a destination. Continued improvement will require sustained investment, dedicated revenue sources, and long-term commitment.
-
Explore South Carolina
- Grades
- State Fact Sheet
- IIJA Grants
South Carolina Infrastructure Grades
A: Exceptional, B: Good, C: Mediocre, D: Poor, F: Failing
Each category was evaluated on the basis of capacity, condition, funding, future need, operation and maintenance, public safety, resilience, and innovation


Aviation
South Carolina’s aviation system includes six commercial airports and a statewide general aviation network. Passenger traffic continues to grow, particularly at Charleston, Myrtle Beach, and Greenville-Spartanburg airports. Recent investments improved infrastructure and safety, but aging facilities, congestion, workforce shortages, resilience needs, and rising construction costs require ongoing attention.
Bridges
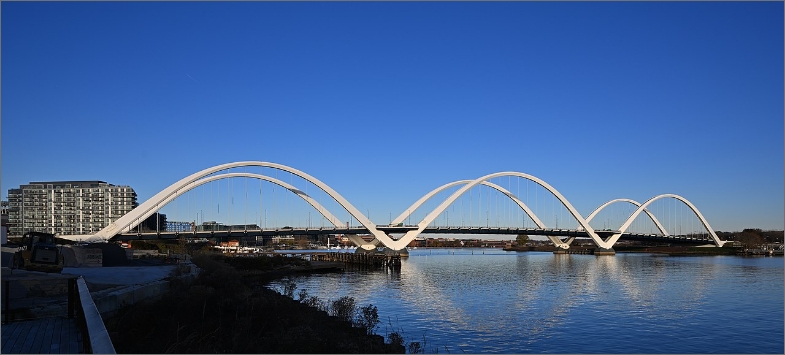
South Carolina is ranked 26th in the nation in bridge inventory with 9,410 bridges. The state is highly dependent on the large number of bridges for connectivity between communities as well as intrastate and interstate commerce. The South Carolina Department of Transportation (SCDOT) manages approximately 90% of all bridges. The average age for bridges is almost 39 years old, close the 50-year service life. Nearly 11% of South Carolina’s bridges are rated as structurally deficient, higher than the national average of 7.5%. Additionally, by Federal Highway Administration standards, more of the state’s bridges are rated in fair (47%) than in good condition (45%). This trend of more bridges being downgraded from good to fair condition is similar to the nationwide challenge of prioritizing repair and preservation work, particularly of structurally deficient bridges. Fortunately, SCDOT has created a Targeted Asset Management Plan (TAMP) to clearly layout life-cycle management goals, track progress toward those goals, and provide transparent accountability of funding for state highway assets. The SCDOT is now in the 4th year of the ten-year plan and ahead of schedule for bridge replacements.
Dams
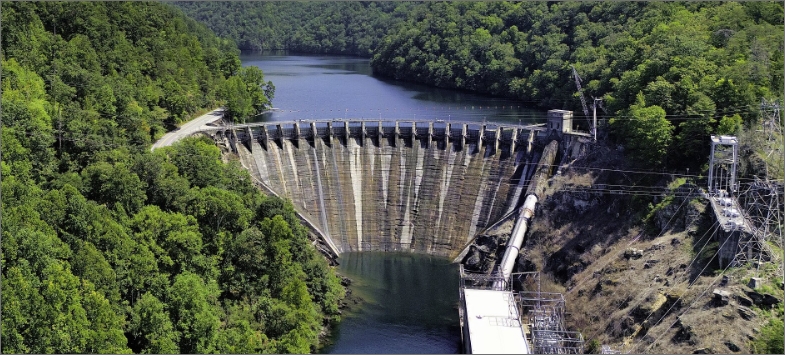
South Carolina has 2,440 dams with an average age of 68 years. State and federal investments have improved inspection capabilities, staffing, and risk management. However, flooding in 2024 caused multiple dam failures, demonstrating the vulnerability of aging infrastructure. Continued investment in rehabilitation, modernization, emergency preparedness, and land-use planning is needed.

Drinking Water
South Carolina’s drinking water systems are managed primarily by local utilities and regulated by the South Carolina Department of Environmental Services. Violations increased between 2023 and 2024, while the EPA estimates drinking water infrastructure needs have grown from $6.1 billion in 2018 to $8 billion in 2023. Most of the need relates to aging pipelines that require replacement or rehabilitation. While urban utilities continue making improvements, insufficient data make it difficult to assess the performance of many smaller systems.
Ports
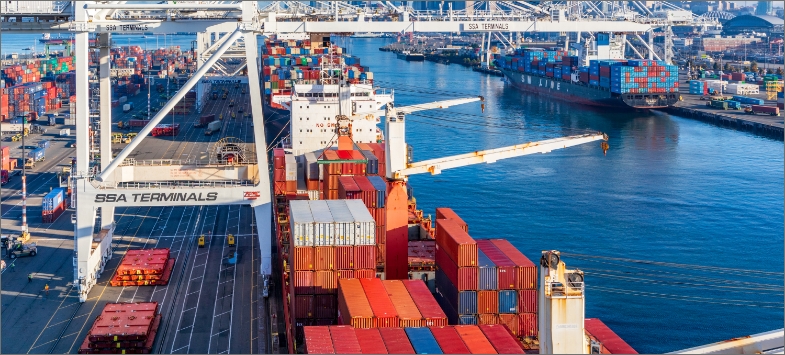
South Carolina’s ports serve as a vital economic engine supporting automotive, aerospace, and advanced manufacturing industries. Container volume increased from approximately 1.5 million TEUs in 2013 to 2.6 million TEUs in 2024. More than $2 billion in investments between 2013 and 2023 expanded terminals, deepened harbors, and improved intermodal connections. Continued investment will be needed to meet freight demand and improve resilience to climate-related risks.
Roads
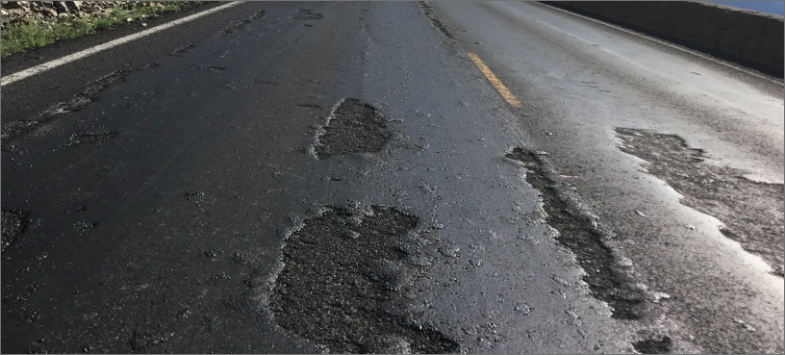
South Carolina maintains the fourth-largest state-owned roadway system in the nation, with more than 90,000 lane-miles. Despite significant resurfacing efforts, about 45% of major roads remain in fair or poor condition, costing motorists an estimated $3 billion annually. Population growth, congestion, and a nearly $1 billion annual funding gap continue to strain the system. The state also remains among the highest in the nation for traffic fatality rates.

Transit
Public transit serves 41 of South Carolina’s 46 counties and provided approximately 11.7 million passenger trips in 2024. Despite its importance, less than 1% of workers use transit to commute. Funding challenges, deferred maintenance, and limited service coverage constrain system performance. Statewide transit funding would need to double to meet future demand through 2050.
Wastewater
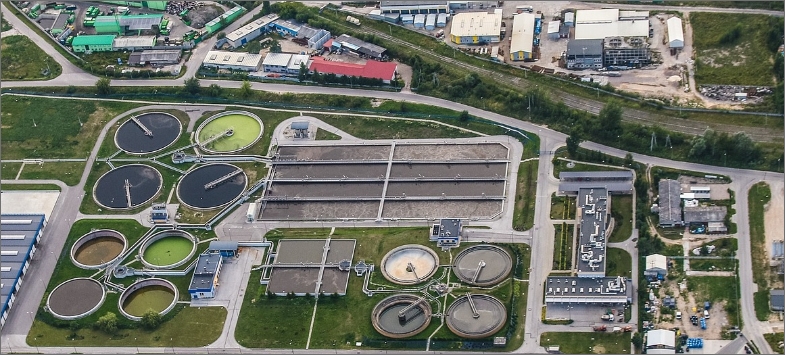
Rapid population growth has increased pressure on wastewater systems, particularly in coastal, Midlands, and Upstate regions. American Rescue Plan Act funding helped modernize infrastructure, but sanitary sewer overflows continue to rise while enforcement actions have declined. Workforce shortages and new environmental regulations add to future challenges.
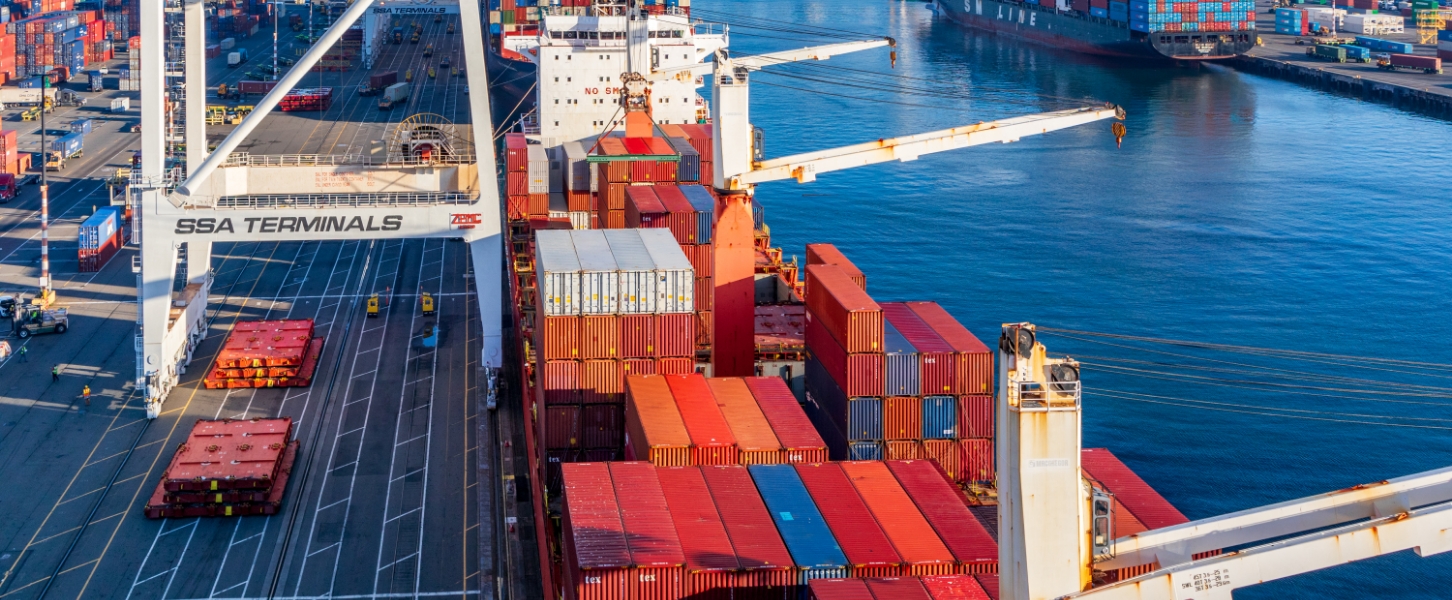
Port operations create 1 in 10 South Carolina jobs, and port-supported jobs pay 32% higher than the state’s average annual wage.
State Fact Sheet
Download Fact Sheet
9,504
Bridges

6%
of Bridges are Deficient

674
High Hazard Dams

$20.2B
in Drinking Water Needs

16 Miles
of Levees
Protecting 2,221 people

45%
of Roads in poor or fair condition

$ 731.00
Motorist pays annually
due to insufficient infrastructure

8.7M
Passenger Trips on Public Transit

$31.9B
Wastewater needs

$43.3B
Total storm damage
(1980-2024)

IIJA Grants
IIJA Funding Announced
Number of IIJA Projects
I-95 over Lake Marion Bridge Replacement Project: This $175 million award will replace four aging bridges over Lake Marion on I-95, reducing congestion and maintenance costs while improving safety along this critical north-south corridor.
Atlantic Intracoastal Waterway: This $12.6 million award will fund improvements to South Carolina’s segment of the Atlantic Intracoastal Waterway, strengthening regional supply chains and supporting efficient freight movement.
Railroad Corner Redevelopment: This $22 million award will construct a pedestrian bridge over two state highways and a railroad, along with a multimodal transit hub, EV and bicycle charging infrastructure, and a public parking structure, improving connections between residential neighborhoods, university campuses, and downtown Orangeburg.

Connect with Your Legislators
Let everyone know how important it is that we continue to invest in the future of America’s infrastructure.
Take Action Today