

2025 Report Card GPA: C
The American Society of Civil Engineers (ASCE) Ohio Council of Local Sections has released its 2025 report card for Ohio’s infrastructure, assessing seventeen infrastructure areas: Aviation, bridges, dams, drinking water, energy, hazardous waste, inland waterways, levees, parks, ports, rail, roads, schools, solid waste, stormwater, transit, and wastewater. Ohio’s infrastructure earned an overall grade of C, indicating significant concerns across multiple sectors – particularly in condition and capacity, where systems are at an increased risk of failure.
Ohio’s infrastructure is a driver of economic activity and quality of life and is critical for the state’s public health and safety. Yet, much of the state’s infrastructure is aging, underfunded, and at risk of not meeting future demand. In May 2025, Ohio voters approved a constitutional amendment to provide funding through the State Capital Improvement Program (SCIP) to allow the state government to issue $2.5 billion in general obligation bonds over ten years, with no more than $250 million a year, for use by local governments to pay for public infrastructure projects. SCIP typically goes to funding infrastructure projects like bridges, roads, water systems and waste facilities. This funding commitment demonstrates public recognition of the urgent need to invest in infrastructure.
Increased spending on Ohio’s infrastructure will have both short-term and long-term benefits. In the short term, infrastructure will stimulate economic activity and create jobs within the state. In the long term, improvements in the state’s infrastructure would benefit both businesses and consumers in the state by lowering the cost of materials, manufactured goods, and delivery of goods, reducing dependency on imports, improving the health of the workforce and enabling the movement of people within the state and strengthening the state’s overall economy.
-
Explore Ohio
- Grades
- State Fact Sheet
- IIJA Grants
Ohio Infrastructure Grades
A: Exceptional, B: Good, C: Mediocre, D: Poor, F: Failing
Each category was evaluated on the basis of capacity, condition, funding, future need, operation and maintenance, public safety, resilience, and innovation


Aviation
As the birthplace of aviation, Ohio’s airports are integral to the economy of the state and nation. The state’s commercial-use airports generally provide sufficient airfield capacity and meet or exceed standards. The airfield pavements are generally in fair condition. Terminal and parking facilities have capacity or modernization issues, some of which are already being addressed or are in the planning stages. Pavement conditions are poor, and funding is inadequate to keep up with deferred maintenance. Ohio’s numerous general aviation airports need attention and investment, and the availability and reliability of funding to provide this necessary investment is lacking.
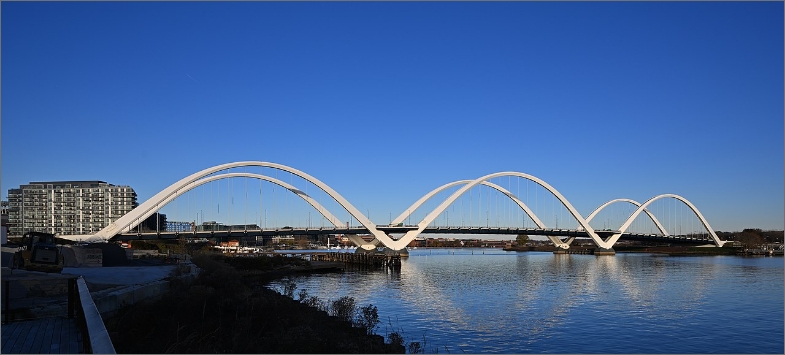
Bridges
Ohio is home to 45,234 bridges, of which 59% are rated in good condition, 35% satisfactory or fair and 6% poor, resulting in a C+ grade. Of the state’s inventory, 2,252 bridges – or 5% – are posted for reduced load capacity, and 200 are closed altogether. The Ohio Legislature has enabled counties to generate additional revenues for improving their local transportation network, including bridges, by levying a $5 permissive fee on vehicle registration, though increases have not been uniformly adopted across the state. In 2019, state leaders raised the state’s gas tax from $0.280 to $0.385. While this resulted in an increase in revenue to local governments of approximately 30% in fiscal year (FY) 2021, annual increases have remained flat over the last three years. In total, Ohio is expected to see a decrease of $877 million annually by 2040. This will lead to funding shortfalls for the Ohio Department of Transportation (ODOT) and local governments. Funding has remained static and is not indexed to inflation, while the system continues to age faster than repairs or replacements can take place. Funding challenges limit the number of replacements or annual repairs. On the other hand, an increased emphasis on system preservation has helped stem the tide of the state’s growing needs, although it cannot do so indefinitely. Tangible improvements have been seen over the last five years with increased funding through the Infrastructure Investment and Jobs Act (IIJA), but this investment needs to be sustained to bend the curve in the right direction.
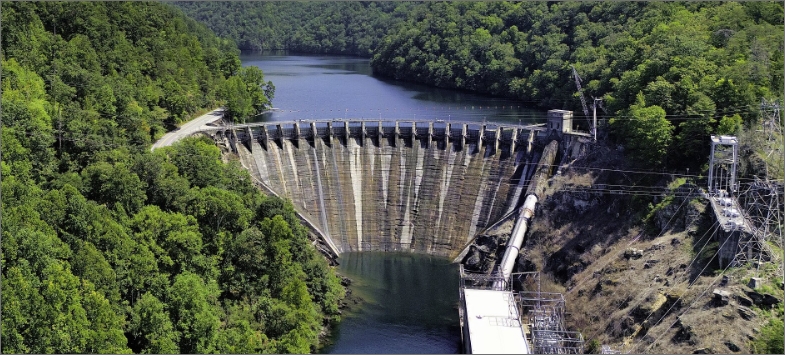
Dams
There are approximately 1,442 state-regulated dams in Ohio, including 417 high-hazard dams that can cause human life loss or significant property damage if they fail. The Ohio Department of Natural Resources (ODNR), Division of Water, Dam Safety Program is primarily responsible for regulating dams in Ohio. Recent increases in federal grant opportunities with a focus on high-hazard dams have allowed the Ohio Dam Safety Program to assist dam owners with funding for engineering studies and construction to rehabilitate, modify or remove high-hazard dams with deficiencies. A prerequisite for eligibility for federal grant funding is an approved Emergency Action Plan (EAP). High-hazard dam owners have recently been creating or updating their existing EAPs to become eligible, therefore reducing risk and improving safety. However, 24% of high-hazard dams still do not have an EAP, according to the National Inventory of Dams (NID). The average high-hazard dam is 69 years old, so many must be upgraded to comply with current structural requirements. Also, an Association of State Dam Safety Officials (ASDSO) 2023 report estimated the cost to rehabilitate all regulated dams in Ohio at $3.47 billion with approximately $1.06billion required for the high-hazard dams. Continued and additional funding is required to maintain and upgrade the Dam Safety Program and ensure the necessary upgrades and adequacy of dams in Ohio.

Drinking Water
Recent assessments reveal that Ohio’s water distribution systems have seen minimal progress since 2021. Despite investments from state and federal sources aimed at rectifying infrastructure shortcomings, the deterioration of these systems continues to outpace improvements. The persistent gaps in upgrading and maintaining water infrastructure are reflected in a stagnated overall score, and overall score remained the same compared to the last evaluation. This situation highlights the ongoing difficulties in implementing necessary upgrades to guarantee residents a reliable and safe water supply. Effective management of water systems in Ohio requires collaboration among local governments, utilities and authorities, emphasizing asset management, proactive maintenance and workforce challenges. Investments in training, technology and infrastructure enhancements are vital to overcoming these obstacles and ensuring sustainable, reliable water services for communities statewide.
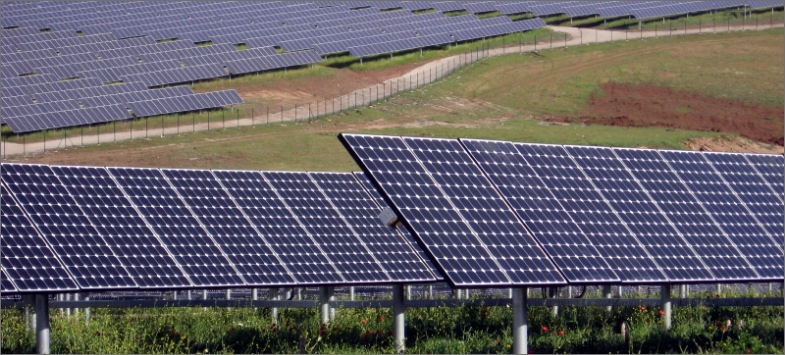
Energy
Ohio’s energy infrastructure is diverse, with a significant portion of its electricity generated from coal and natural gas. Ohio is home to several key oil refineries – including PBF Energy’s Toledo Refinery, Marathon Petroleum’s refining complex in Canton and Findlay and Sunoco Logistics’ former BP-Husky refinery in Toledo. These refineries process crude oil into essential products like gasoline, diesel, jet fuel and heating oil, which are crucial for transportation, industrial use and regional energy security. In 2023, Ohio’s energy landscape saw significant changes, with shale gas production driving a 13-fold increase in natural gas output since 2013, accounting for 97% of the state’s gross natural gas withdrawals. Ohio also ranked as the seventh-largest ethanol producer in the U.S. in 2022, with seven ethanol plants having a combined production capacity of 765 million gallons per year. Despite declining coal use, Ohio remained the tenth-largest coal-consuming state in 2022, relying on coal from other states, while natural gas became the dominant fuel for in-state electricity generation. As the eighth-largest in electricity production and fourth-largest in electricity sales in 2023, Ohio’s energy mix continued to shift toward cleaner sources. However, there has been a gradual shift towards renewable energy sources like wind and solar power. Ohio’s energy landscape is influenced by its large population, industrial economy and seasonal temperature variations, making it one of the top ten states in total energy consumption. Despite this, the state’s per capita energy consumption is only slightly above the national average. By the end of 2022, the industrial sector accounted for about one-third of Ohio’s total energy use, with manufacturing – particularly in chemicals, motor vehicles, fabricated metal products, food and beverages and machinery – remaining a significant contributor to the state’s economy. Ohio’s transportation sector is the second-largest energy consumer, representing approximately one-fourth of the state’s energy consumption, supported by its extensive interstate highway system. Ohio’s transportation sector is the state’s second-largest energy consumer, driven by its strategic location as a major logistics hub in the Midwest, with key highways, railroads and airports connecting the
state to national and international markets. The state’s large population and high vehicle ownership rate contribute to significant gasoline consumption, particularly in urban areas like Cleveland, Columbus and Cincinnati. Additionally, Ohio’s role as a central hub for freight trucking – with its extensive interstate network – fuels high demand for diesel. At the same time, the state’s airports and rail industry require substantial energy for air travel and freight transport. The growth of suburban areas and the state’s reliance on personal vehicles due to limited public transportation options further increases energy consumption. With its thriving manufacturing sector and pivotal role in regional and national trade, Ohio’s transportation infrastructure remains a key driver of energy use, making it a critical component of the state’s overall energy consumption. The residential sector uses nearly as much energy as transportation, accounting for about one-fourth of the total. In contrast, the commercial sector consumed less than one-fifth of Ohio’s energy. Data centers are becoming a significant source of energy consumption in Ohio due to several factors like the rapid expansion of cloud computing, big data and digital service providers in the state. Dayton, Akron and the central region of the state have become notable hubs for data center facilities, but they have the potential to put serious strain on the electric grid and other natural resources. According to a recent study, data centers could possibly account for 6% of all power use in the United States by 2026.

Hazardous Waste
The Ohio Environmental Protection Agency (Ohio EPA) is responsible for the environmental programs in the state. In particular, the Division of Environmental Response and Revitalization (DERR) oversees the investigation and cleanup of contaminated sites; permitting, inspection, compliance and reporting of hazardous waste sites. It also provides assistance and guidance for the voluntary cleanup and reuse of brownfields. Three programs under the U.S. EPA are shaping the nation’s hazardous waste infrastructure: Superfund, Resource Conservation and Recovery Act (RCRA) and brownfields. In addition, Ohio also has an underground storage tank program administered by the Department of Commerce (State Fire Marshall). Ohio has 53 sites listed on the U.S. EPA’s Superfund, National Priority List (NPL). Ohio is ranked fourth in total number of hazardous waste generators under the RCRA program, not unexpectedly, as it is the nation’s seventh most populous state. The legal immunity bill passed in Ohio in2020 for brownfields has helped the program significantly over the last four years. To date, $636 million has gone to support 626 projects in 86 out of 88 counties in Ohio. This program aims to unlock Ohio’s more than 9,000 former industrial and commercial sites that can bring in millions of dollars in additional tax revenue, create jobs and steward the environment for redevelopment through brownfields remediation. Despite efforts to address hazardous waste issues, Ohio’s infrastructure remains underfunded and faces significant challenges in managing contamination, which has resulted in delays in remediation and rising long-term costs. The lack of sufficient funding and resources– combined with the state’s ongoing struggle to clean up and repurpose contaminated sites – has hindered progress.
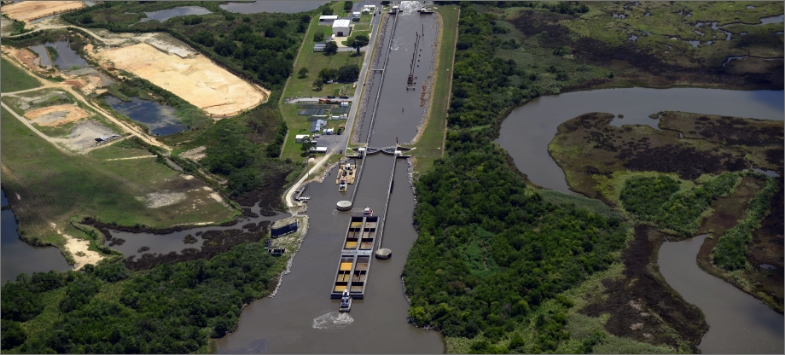
Inland Waterways
Ohio’s inland waterway system is composed of 541 miles of the Ohio River and nine navigation locks and dams. More than 61 million tons of cargo passed through Ohio’s commercial locks and dams in 2022, valued at $15.7 billion. Many of these structures are well beyond their design life and will require prioritized rehabilitation funding for continued operational reliability. The Ohio River spans 981 miles, originating at the confluence of the Allegheny and Monongahela Rivers in Pittsburgh, Pennsylvania and flowing into the Mississippi River at Cairo, Illinois. Waterborne transportation improvements on the river began in 1824with channel clearing, followed by the completion of 51 locks and dams in 1929, which enabled year-round navigation. This progress continued through 2018 when the original system of locks and dams was replaced with the current 19-lock and dam system. The U.S. Army Corps of Engineers (USACE) provides safe, reliable, efficient and environmentally sustainable waterborne transportation systems that support commerce, national security and recreation. Waterborne transportation is USACE’s earliest CivilWorks (CW) mission, dating back to 1824, when federal laws authorized and funded USACE to improve safety on the Ohio and Mississippi Rivers and at several ports.
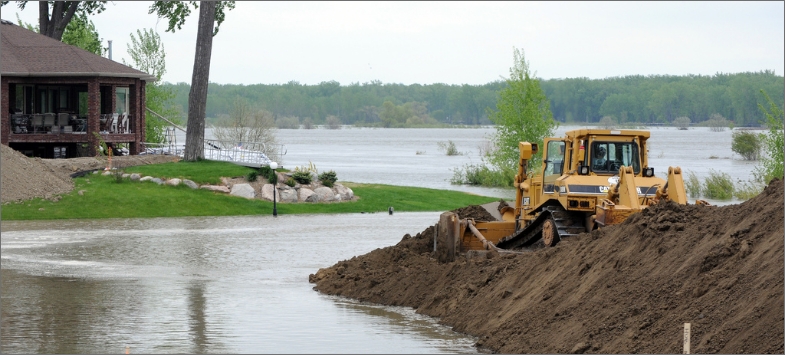
Levees
Ohio has over 172 miles of levees, primarily along the Ohio, Scioto, and Great Miami Rivers. Levees are critical in reducing damage to communities from seasonal flooding caused by heavy rainfall, snowmelt and storms. Ohio’s network of levees reduces flood damage risk for more than 165,000 people and $37 billion in property. Many of these levees were constructed in the early 1900s using outdated design standards. The components of these older systems are deteriorating, requiring costly maintenance or replacement. Most levee systems in Ohio have not had risk assessments, and inspection standards are inconsistent across the state. When levees fail, the consequences can be catastrophic, leading to widespread property damage, displacement of residents and economic losses. As extreme weather events become more frequent, the reliability of Ohio’s levees will be increasingly tested. Upgrading and maintaining these structures and improving floodplain management are critical to mitigating future flood risks in the state.

Public Parks
and connect people. Overall, the needs and funding of Ohio parks are uneven, varying throughout the state and among those managed by federal, state and local entities. The majority of residents of Ohio urban centers live within 10 minutes of a park. However, the total area of parkland and amenities provided is still insufficient for Ohioans, not to mention that usage has increased since the COVID pandemic. Funding shortfalls lead to inadequate maintenance of parks and structures. One-time investments from the American Rescue Plan Act (ARPA) and the Infrastructure Investment and Jobs Act (IIJA) made a significant positive impact, but are due to expire in the coming years.
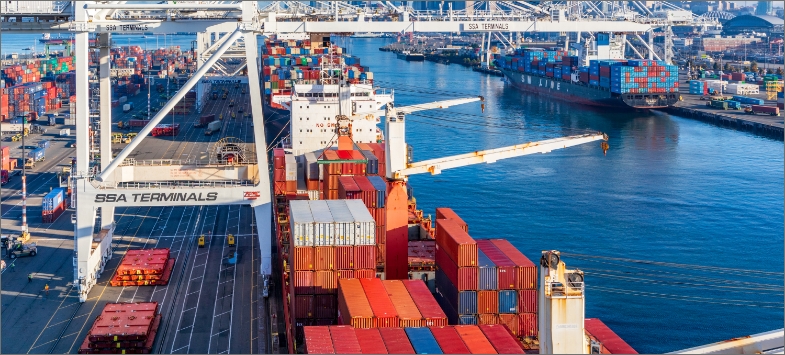
Ports
Ohio’s ports serve as key economic drivers for the state, located along the north coast of Lake Erie and the Ohio River. The larger ports are situated on Lake Erie, while smaller, mostly private terminals and commercial docks supporting the intermodal transfer of industrial goods and bulk cargo from barges are found along the Ohio River in designated Port Statistical Areas. These areas aggregate commercial docks and terminals within specific geographic boundaries, which often span county and municipal lines. Port Statistical Areas are common along the Ohio River, while port authorities defined by federally designated harbors, counties, or city boundaries are typically found along the Lake Erie coast. While Ohio’s ports are strategically located and possess significant excess capacity, their overall quality is hindered by aging infrastructure, inconsistent asset management and limited funding. Despite recent progress through federal and state grant programs, Ohio’s ports continue to fall behind national peers in modernization, efficiency and resilience.
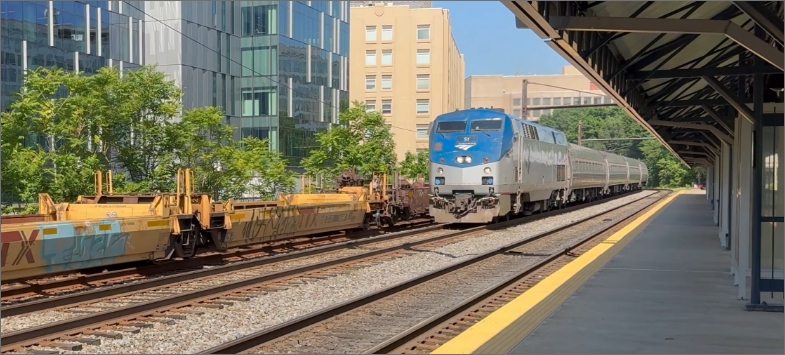
Rail
Ohio has an extensive rail network that is closely integrated with the state’s economy. Ohio’s 40 freight railroads (four Class I, one Class II and 34 Class III) carry approximately100 million tons of freight annually across over 5,000 miles of track, serving 86 of Ohio’s 88 counties. Ohio has 13 intermodal terminal facilities, more than 100 rail-served transload facilities and numerous maritime facilities along Lake Erie and the Ohio River. Freight railroads pay for all operating expenses and most of their capital expenses through their own revenues. Public funding to support capital projects is available only under specific circumstances. Class II and Class III railroads rely more on public funding than Class I railroads. Amtrak operates long-distance passenger rail service in Ohio along three routes: Capitol Limited (Chicago to Washington), Cardinal (Chicago to New York) and Lake Shore Limited (Chicago to Boston). Due to the scheduling of connecting trains in Chicago, these trains pass through Ohio at night. Based on past success, Ohio should continue to invest in eliminating or improving the safety of highway railroad crossings to reduce accidents. Ohio should also continue to facilitate the upgrade and expansion of the use of wayside detection systems initiated after the East Palestine train derailment. There remains a need to establish sustainable, long-term funding mechanisms at all levels of government to support rail infrastructure investments that generate public benefits and attract private investment.
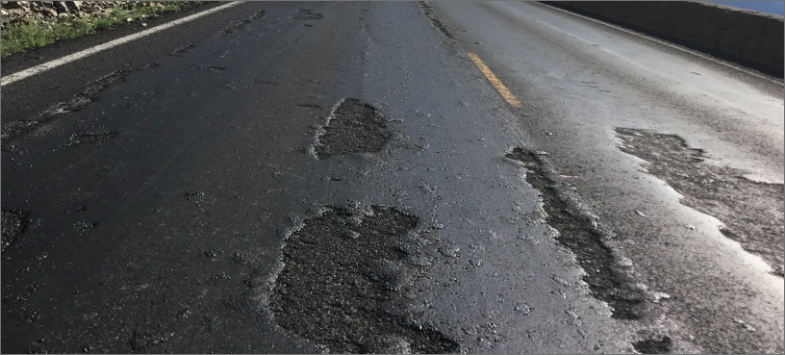
Roads
Ohio boasts one of the nation’s most extensive and heavily traveled roadway networks:60% of the U.S. and Canadian populations are within a one-day drive. Recently, increases in state and federal funding – including the 2019 state motor fuel tax and the 2021federal Infrastructure Investment and Jobs Act (IIJA) – have improved the condition of Ohio’s roadways. Some 69% of Ohio’s major roads were rated in fair condition or better in 2022, up from 65% in 2018. Despite recent increases in roadway funding, challenges persist in efficiently operating and maintaining the system. Rising costs due to inflation and workforce shortages pose obstacles. Ohioans lose more than $14.4 billion yearly due to deferred maintenance, including vehicle wear and tear, wasted fuel from congestion and crash-related expenses. More than 2,300 people died on Ohio’s roads in 2022 and2023, but the statewide fatality rate was 1.15 per 100 million vehicle miles traveled, lower than the national average of 1.33. However, in rural areas, the fatality rate of 1.61 is near the national average of 1.67. To meet the goals of Ohio’s long-range transportation plan (Access Ohio 2045), state and local decision makers should continue to utilize the increased state and federal investment, develop financially sustainable funding sources for transportation improvements, and sustain investments in roadway safety to facilitate the movement of people and freight.

Schools
Ohio’s school infrastructure is facing several challenges, including aging facilities, insufficient funding and a lack of comprehensive emergency preparedness. Many facilities over 50 years old require significant structural upgrades to meet modern safety and educational standards. While the state has invested over $10 billion since 1997, a large funding gap remains, with many schools relying heavily on local property taxes, which perpetuates disparities between affluent and less affluent districts. To address these issues, the Fair School Funding Plan (FSFP) was signed into law in 2021 to provide equitable funding, but full implementation is still needed. In addition, improving the resilience of school facilities through sustainability practices and structural upgrades –such as earthquake-resistant designs and tornado shelters – is essential for enhancing safety. Engaging communities and developing robust asset management plans are also critical to ensuring long-term infrastructure effectiveness.
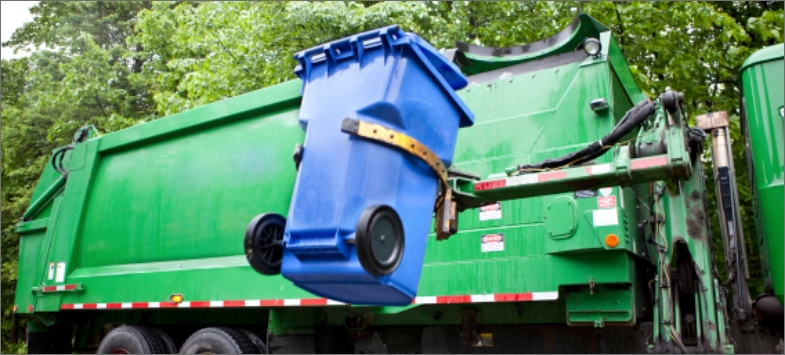
Solid Waste
Ohio solid waste management programs provide options for recovery, recycling and/or disposal of solid waste. Most landfills are self-funded through waste collection fees, including collection and disposal fees. Disposal rates range between $9 and $77 per ton, with an average of $44.50 per ton. A large portion of this revenue from fees goes directly to the operations and maintenance of the individual disposal facilities, including landfills. Landfills remain the primary facilities for waste disposal. In 2022, Ohio received solid waste at 37 licensed municipal solid waste landfills, with a combined remaining gross airspace of over 823 million tons, or approximately 32 years of expected landfill life. Residential and commercial solid wastes generated within Ohio totaled more than 15.7 million tons in2022, equating to 7.27 pounds per person per day, greater than the 2018 national average of 4.9 pounds per person per day. Ohio’s solid waste infrastructure earned a B- due to reliable landfill operations, sufficient remaining capacity and strong regulatory oversight. However, opportunities remain to improve waste diversion and reduce per capita waste generation, which exceeds the national average.

Stormwater
With a population of nearly 12 million, Ohio has an extensive aging stormwater infrastructure to manage and protect. Ohio has approximately 137 stormwater utilities (the 6th most in the US). While Ohio stormwater utility rates increased by 9% from2020 to 2024, the Engineer News Record (ENR) Cleveland Building Cost Index (BCI)and Construction Cost index (CCI) from March 2020 to March 2024 increased by over37-percent and 16-percent, respectively. Ohio currently spends between $500M to$900M per year on its stormwater infrastructure but needs up to $900M in additional annual funding to meet future needs.

Transit
Transit is in mediocre to poor condition, with a grade of C-, improving from a D in 2021.Ohio has 26 urban and 40 rural transit systems serving 83 of the state’s 88 counties. These systems provided 70.3 million rides in 2023, a 45% decrease over the last 16 years. In 2023, 501 of 3,707 (13.5%) revenue vehicles exceeded their useful lives, a significant improvement since 2018, when 636 of 3,559 (17.9%) revenue vehicles exceeded their useful lives. However, this still lags behind the 12% figure in 2007. This trend coincides with the reversal of a long-term lack of state funding for transit, which decreased from$42.3 million in 2000 to $7.3 million in 2013 and to $6.5 million in 2018 and 2019.State funding then increased to $70 million in 2020 and 2021 and dropped to $37million in 2022. In 2022, this amounted to just $3.15 per person, ranking Ohio 31st in per capita funding – 25 times less than the average state at $76.67 per capita.
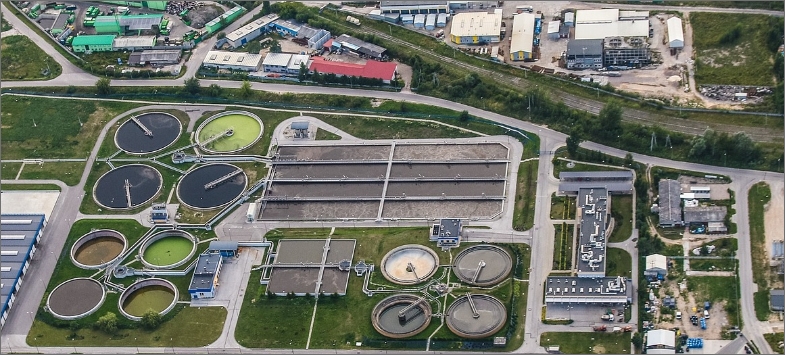
Wastewater
Approximately 81% of Ohio’s population of 11.8 million people rely on municipal wastewater collection systems and treatment plants. According to the 2022 Clean Watersheds Needs Survey (CWNS), the state needs almost $16 billion in clean water improvements for wastewater to meet the water quality and human health goals of the Clean Water Act (CWA). Also in 2022, an Ohio survey found that 65% of wastewater utilities have increased rates. This trend is expected to continue as efforts to reduce Combined Sewer Overflows (CSOs) and Sanitary Sewer Overflows (SSOs) remain a priority. Since 2017, infrastructure investments have resulted in a 14% reduction in permitted CSO outfalls and decreased overflow volumes. And while the Infrastructure Investment and Jobs Act (IIJA) provided approximately $675 million in wastewater funding to Ohio, the principal forgiveness loans, similar to a grant, were competitively available to qualifying communities while remaining communities were eligible for traditional loans. As for addressing aging infrastructure in Ohio, most communities only address it when it fails. Utility rate structures typically address operation and maintenance of their systems rather than proactive capital improvement. Ensuring clean water for Ohioans needs a one-water approach for managing wastewater, drinking water and stormwater needs. Integrated solutions are necessary for water management challenges that are complex, interconnected and costly.
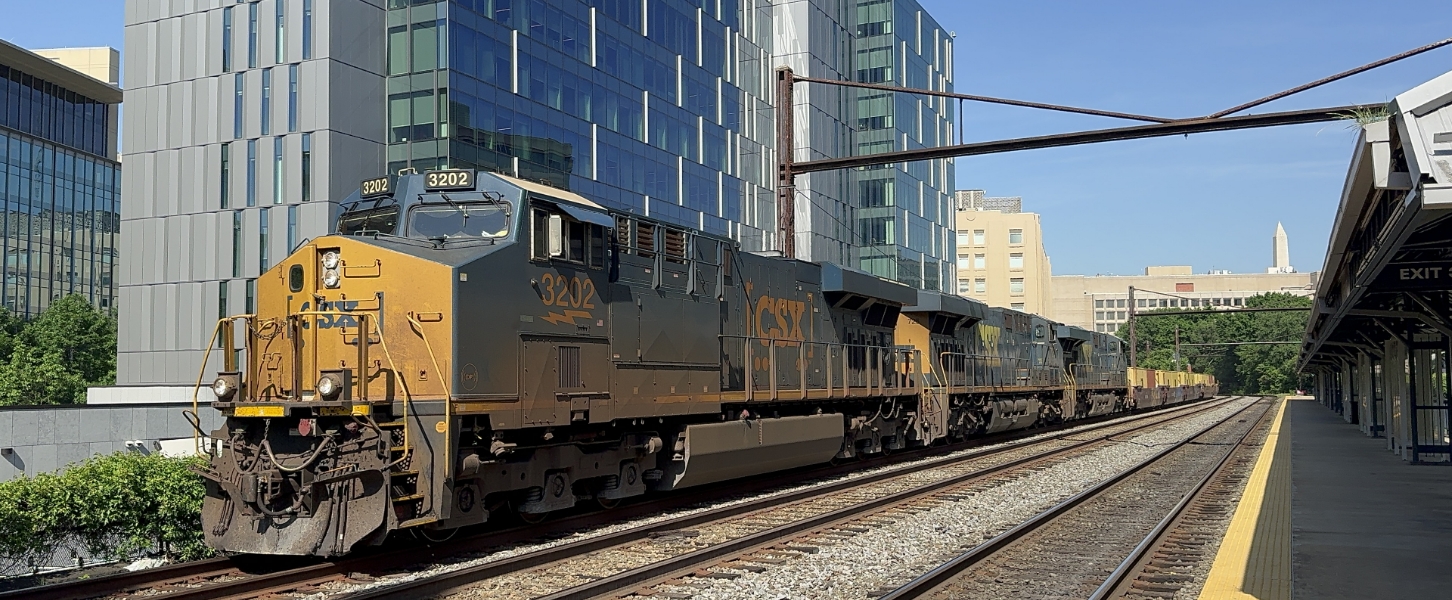
Ohio’s 38 freight railroads carry approximately 289M tons of freight annually.
State Fact Sheet
Download Fact Sheet
26,713
Bridges
5%
of Bridges are Deficient

421
High Hazard Dams

$43.1B
in Drinking Water Needs

205 Miles
of Levees
Protecting 188,000 people

31%
of Roads in poor or fair condition

$ 624.81
Motorist pays annually
due to insufficient infrastructure
76.2M
Passenger Trips on Public Transit
$66.3B
Wastewater needs

$33.0B
Total storm damage
(1980-2024)

IIJA Grants
IIJA Funding Announced
Number of IIJA Projects
Brent-Spence Bridge: This $1.6 billion award will upgrade the Brent-Spence Bridge connecting Covington, Kentucky, and Cincinnati, Ohio, resulting in improved interstate and local traffic flow on one of the nation’s worst truck bottlenecks, which currently carries more than $400 billion in freight annually.
Western Hills Viaduct: This $127 million award will replace the 85-year-old structurally deficient Western Hills Viaduct over Mill Creek Valley with a new structure, resulting in improved safety and connectivity through a redesigned interchange with I-75.
Greater Cleveland Regional Transit Authority Rail Vehicle Replacement: This $130 million award will purchase 60 new light rail and heavy rail vehicles to replace older models, resulting in improved system reliability, enhanced safety, and greater operational flexibility by eliminating the need for two separate fleets.
Connect with Your Legislators
Let everyone know how important it is that we continue to invest in the future of America’s infrastructure.
Take Action Today