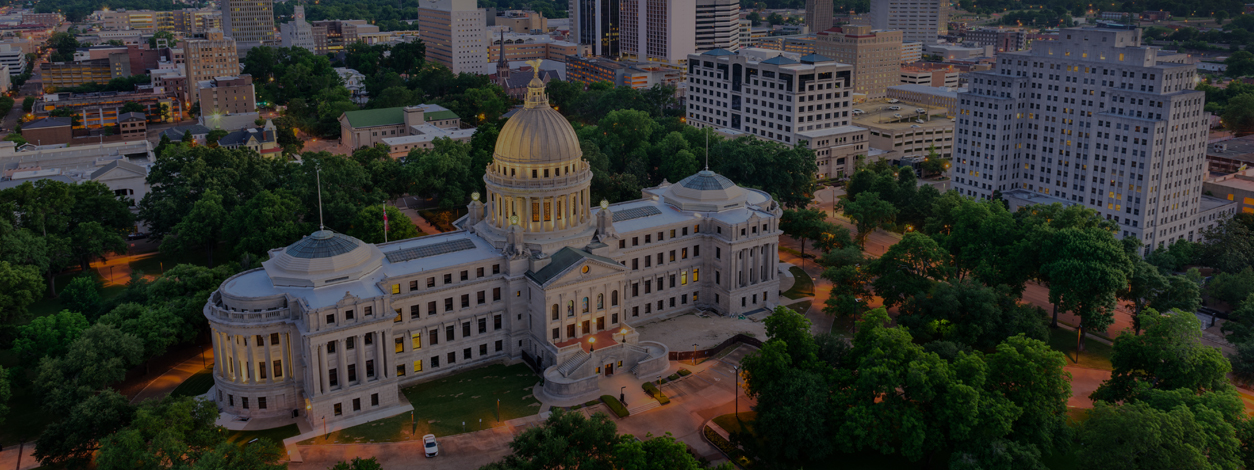

2024 Mississippi Infrastructure Report Card
2024 Report Card GPA: C-
Mississippi’s infrastructure systems play a critical role in the state’s economic prosperity and preserves – and even enhances – the quality of life for all Mississippians. However, our infrastructure systems have faced numerous challenges, from natural disasters and funding trials to a lack of sufficient trained personnel to design, construct, operate, and maintain the infrastructure systems in the recent past. Yet, every time Mississippians face a challenge, they rise to meet it. Over the past four years, Mississippi has answered the Mississippi Section of the American Society of Civil Engineers (ASCE) 2020 call to invest in our infrastructure systems to improve the lives, well-being, and future of not only its citizens but all who visit the Hospitality State. The impact of these investments can be seen through the overall improvement trends for our state’s infrastructure systems. Between 2020 and 2024, four of the infrastructure categories improved (bridges, dams, rail, and solid waste), six remained the same (aviation, energy, inland waterways, levees, ports, and roads), and only two categories deteriorated (drinking water and wastewater). Additionally, the overall GPA for Mississippi’s infrastructure rose and, for the first time since the inception of the Report Card for Mississippi’s Infrastructure, the GPA improved to a C-, the same level as the 2021 Report Card for America’s Infrastructure.
Mississippi ASCE’s Report Card Committee of engineering experts assessed the overall GPA as a C-.
Mississippi ASCE has continued to find that when there is investment in Mississippi’s infrastructure, there are more jobs, resulting in more economic growth. However, we still face challenges due to aging infrastructure, lack of routine maintenance, inconsistent data collection, and limited funding. Ongoing issues continue to impact residents’ quality of life and threaten Mississippi businesses. Fortunately, Mississippi is seeing where investments from the state and federal governments and the private sector – including dams, ports, and rail – continue to result in benefits, including economic productivity, increased protection of human health and safety, and community capacity building.
To view the Mississippi Report Card executive summary brochure, click here.

-
Explore Mississippi
- Grades
- State Fact Sheet
- IIJA Grants
Mississippi Infrastructure Grades
A: Exceptional, B: Good, C: Mediocre, D: Poor, F: Failing
Each category was evaluated on the basis of capacity, condition, funding, future need, operation and maintenance, public safety, resilience, and innovation
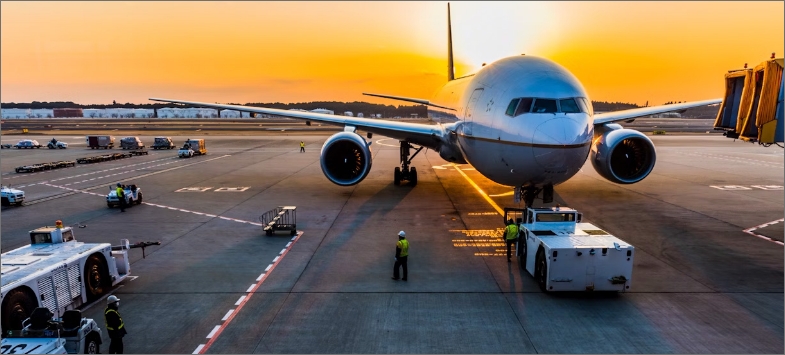

Aviation
Mississippi’s 73 public-use airports – with three primary in the National Plan of Integrated Airport Systems (NPIAS) – employ over 20,000 people and produce a total economic output of $2.5 billion. Though recent years (2021-2023) have seen a modest uptick (2%) in air travel, it pales in comparison to the longer-term trend (2007-2021) where air travel declined by 18%. This overall decrease impacts the amount of funding for aviation infrastructure the state receives from passengers and the federal government. Aviation infrastructure in Mississippi is heavily dependent on support from the federal government. Almost half of the airports in the state have had runway rehabilitation projects over the past five years. There are no significant operations and maintenance needs at Mississippi’s largest airports, partly because of recently reduced passenger traffic. However, maintenance projects are not eligible for federal funding and, as a result, are deferred in smaller airports serving more rural and low-income communities.
Bridges
Mississippi’s 16,756 bridges move people and freight for essential supply chain functions and access to opportunities in a largely rural state. 1,053 of those structures, 6.3%, are classified as poor (formerly structurally deficient) – down from 1,484 in 2019 – and 26th among all states. The average age of Mississippi’s bridges is approximately 38 years-old, with 29% of the state’s inventory exceeding their design life of 50 years. By deck area, approximately 57% of Mississippi’s bridges are in good condition, 40% are in fair condition, and 3% are in poor condition, which is better than nationwide values. In 2022, MDOT dedicated roughly $952 million of its $1.1 billion budget towards road and bridge projects and repairs, representing 83% of the total budget. MDOT estimates that, for the fiscal year ending in June 2023, 50% of revenue will be from federal funds, 22% from state fuel taxes, and the remaining 28% from various other state and local taxes and fees. Generating revenue for bridge projects has been challenging, as Mississippi’s fuel tax has stagnated at 18 cents per gallon since 1989. From a funding perspective, raising the fuel tax and adjusting for inflation would directly and significantly benefit the transportation network with minimal impact on taxpayers.
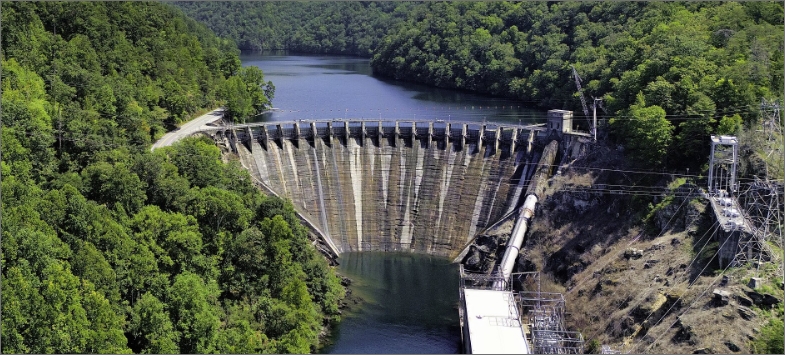
Dams
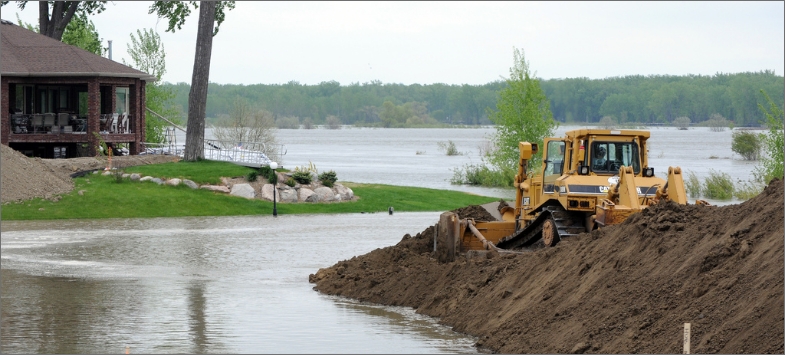
Mississippi’s 6,853 dams, owned by federal, state, or local governments, private owners, and public utilities, provide flood control, navigation, water supply, and recreation. Of those structures, the Mississippi Department of Environmental Quality (MDEQ) classifies 347 as high-hazard potential (HHP) dams – describing potential harm to property and life under failure – with 51 significant-hazard and 6,445 low-hazard. The vast majority of HHP dams in the state – 323 , or 93% – have an Emergency Action Plan (EAP). That rate is more than double the rate from 2019 and better than the national average. Mississippi’s legislature created the Mississippi Dam Safety Fund in 2020 to provide grants for HHP dam work, but only $4 million has been allocated through September 2023. Available funding streams are insufficient compared to a backlog of $760 million needed to rehabilitate the state’s HHP dams and the $9.68 billion cost to upgrade dams with conditions rated less than satisfactory.

Drinking Water
Mississippi’s drinking water infrastructure urgently needs rehabilitation. The state has 1,189 water systems, many operating infrastructure assets beyond their design life. In 2022, 13% of public water systems in the state had a documented Safe Drinking Water Act violation or were listed as an enforcement priority. A federal emergency disaster was declared in the City of Jackson following August 2022 flooding, resulting in low to no drinking water pressure for many customers for multiple days and a boil water notice in place for most of the city for approximately 17 days. Many Mississippi water systems experience between 30% and 40% non-revenue water loss, compared to a 15% industry standard. One-time funding infusions have helped, with $600 million for Jackson alone from the federal government and $770 million in additional federal money available statewide from 2023-26. However, this funding rate is only 10% of the total repair needs, which EPA now estimates at $8 billion over the next 20 years. Decision-makers and owner-operators at all levels of government should partner to improve financial conditions and innovate to deliver projects that improve water quality and reliability.
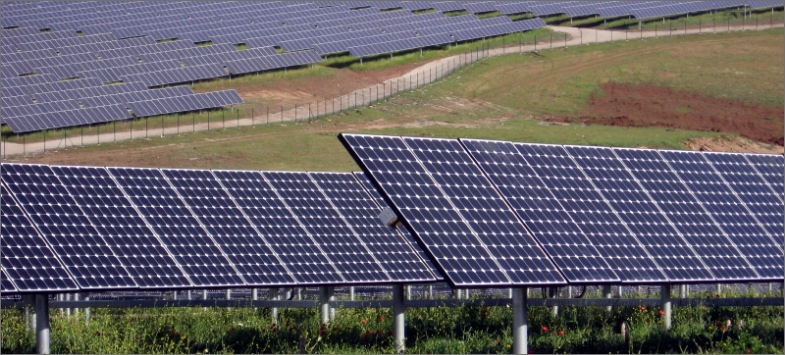
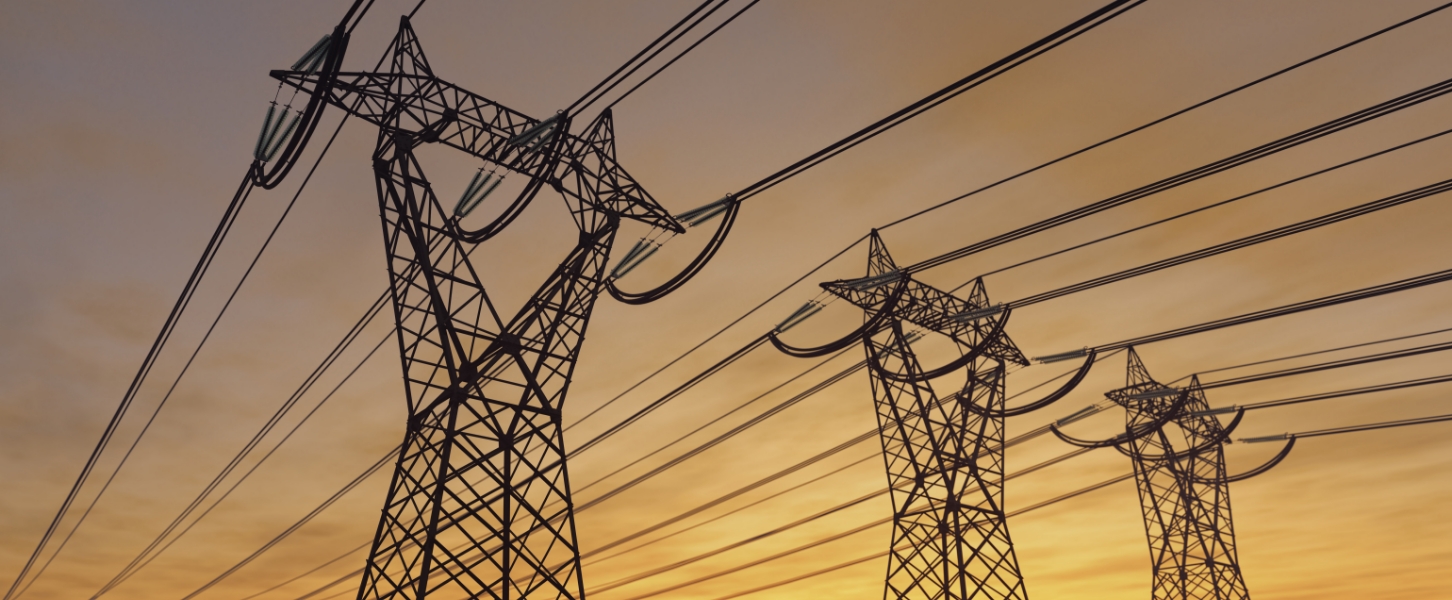
Energy
Mississippi has diverse and abundant electric power generation assets and reliable transmission and distribution capacity, making the state a dependable energy state. Approximately 75% of Mississippi’s energy infrastructure is privately owned and 25% is cooperatively owned. The state has over 27,000 miles of natural gas pipelines and more than 4,000 miles of high and low-voltage transmission lines. In general, pipelines are in adequate condition. However, the electricity grid is aging, with 67% of the transmission and 37% of the distribution systems constructed before 1970. Mississippians pay roughly the same as the national average for natural gas, coal, and electricity. Continued investment in energy infrastructure has increased reliability and reduced both duration and frequency of disruptions.
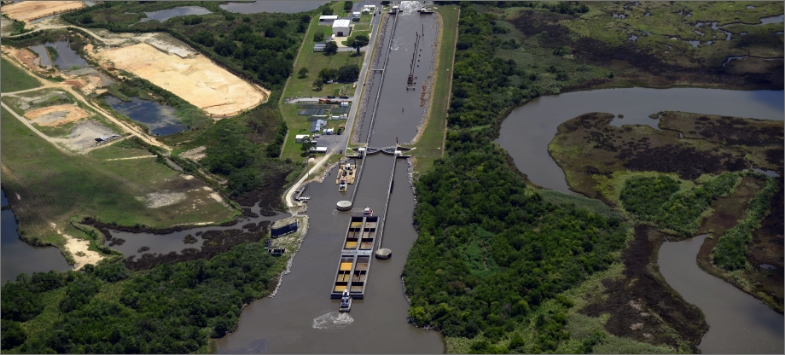
Inland Waterways
Mississippi has 870 miles of inland waterways and eight locks throughout the Tennessee-Tombigbee Waterway, the Yazoo River, the Mississippi River, the Pearl River, and the Gulf Intracoastal Waterway. The top two locks in the state for cargo passage – the John C. Stennis Lock and Dam and the Jamie Whitten Lock and Dam – are located on the Tennessee-Tombigbee Waterway. Nearly 2,000 vessels pass through the state’s locks every year, carrying over 4.3 million tons of domestic and foreign commodities, including coal, petroleum products, paper, concrete, steel, grain, and farm products. Adequate reinvestment and modernization of the state’s inland waterways is critical. Over the next 20 years, approximately $4.9 billion will be needed for Mississippi inland waterways, totaling nearly $250 million annually.
Levees
Mississippi is home to over 979 miles of concrete floodwalls and earthen levees that protect more than 300,000 people and $21.8 billion in property. Of the state’s 108 individual levee systems, 26 were constructed by the U.S. Army Corps of Engineers (USACE) and receive regular inspection. Of these 26, 14 levee systems are rated unacceptable, meaning the condition of the system may prevent it from performing as intended or a serious deficiency has gone unaddressed. Little to no information is available about the conditions of non-USACE levees. The lack of publicly available information regarding Mississippi’s locally-owned levees poses a challenge when assessing the state’s overall condition, funding, and safety.
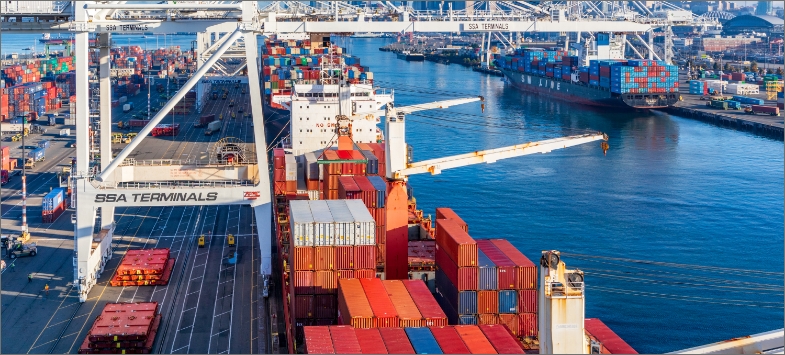
Ports
As major import and export points for the state’s industries, Mississippi’s 16 ports are essential to a thriving economy. They provide access to three waterway systems: the Mississippi River, the Tennessee–Tombigbee Waterway, and the Gulf of Mexico. Port conditions vary widely across the state, as the coastal ports were almost entirely rebuilt after the devastation of Hurricane Katrina in 2005. Recent upgrades include a $570 million restoration program at the Port of Gulfport and rail investments at both the Port of Bienville and Lowndes County Port. In 2023, the Mississippi legislature provided the largest-ever investment for port infrastructure by setting aside 38% of the $10 million Multi-Modal Transportation Improvement Program (MTIP) for the state’s ports. However, challenges remain, including the current dredge depths of the three coastal ports. Since the expansion of the Panama Canal in 2016, “Neopanamax ships” with design drafts up to 50 feet are increasingly replacing Panamax ships. These smaller vessels were previously the largest capable of passing through the Panama Canal. For Mississippi to continue accepting ocean freight ships, ports must be designed to take these larger Neopanamax vessels. The funding of routine maintenance also challenges many ports, as external grants often favor expansion and internal budgets sometimes fall short of maintenance costs. Mississippi is geographically well-positioned to continue growing its port commerce, a vital portion of its economy. To seize the opportunity of future markets, Mississippi ports need to continue improving multi-modal connectivity and increasing ship size capacity within the ports.
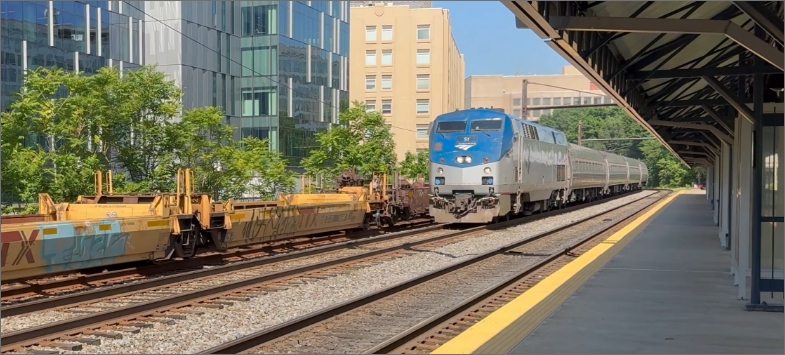
Rail
Mississippi’s 2,400-mile railroad system includes five Class I freight rail owners; their mainlines serve five of the state’s six top-tier freight corridors. Less than 9% of the Class I system is weight-restricted, below the industry goal of 10%, indicating the rail lines are in good condition. Some 35% of short-line Class II and III track miles had that restriction in 2020, down from 57% in 2017. Class I systems invest revenue in their infrastructure, but smaller-budget Class II systems struggle to leverage complicated public funding opportunities resulting in deteriorating conditions. Half of the state’s 2,200 grade crossings lack active warning devices, and 10% lack any warning devices. Currently, two long-distance passenger routes operate through Mississippi, connecting New Orleans to Memphis via Jackson and New Orleans to Atlanta via Meridian. The Infrastructure Investment and Jobs Act (IIJA) delivers dollars to restore a third long-distance passenger route on the Gulf Coast and upgrade rail bridges. Still, poor coordination with freight operations on the Gulf Coast will remain a significant challenge for the rail’s potential to move people.
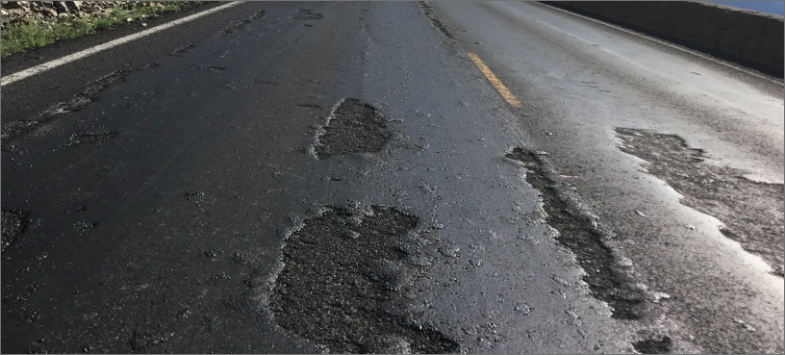
Roads
Mississippi has 85,845 road miles, which are made up of 74,887 miles of roadway and 10,958 miles of county roads. Mississippi’s road infrastructure is essential to life in the State as most residents travel via private vehicle versus public transportation. In 2022, the state had one of the worst road conditions in the country, with over half of its major urban roads and a quarter of its rural roads in poor shape. These conditions cost the average driver $840 per year in additional vehicle expenses due to the poor quality of the roads. Moreover, the state had a very high fatality rate on its roads, with 1.71 deaths per 100 million vehicle miles traveled, compared to 1.36 nationally. The state’s gas tax, which funds most roadway projects in Mississippi, has been stagnant at 18.4 cents –per gallon for over three decades. Further, the state’s purchasing power continues to erode due to inflation and other factors, resulting in a lack of funds for essential road repairs and upgrades across the state. The gas tax could be increased slightly and adjusted to inflation to address the annual shortfall of at least $400 million. The state is implementing innovative methods to evaluate road conditions more accurately and to improve the efficiency and effectiveness of road maintenance and improvement projects.
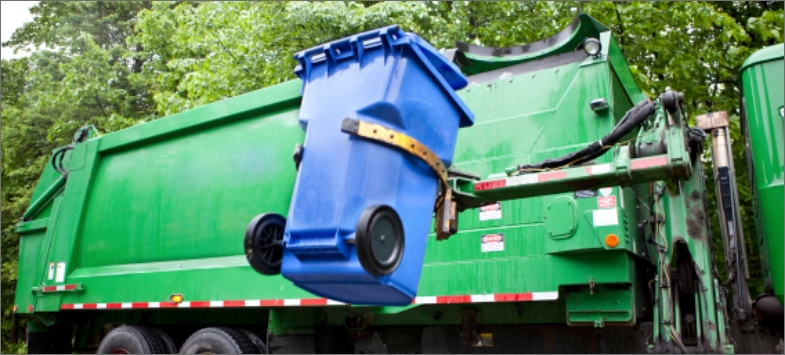
Solid Waste
Mississippi generates over six million tons of municipal waste annually, which has been steady for years. There are 20 permitted landfills for non-hazardous industrial and municipal solid waste and 131 commercial rubbish disposal facilities. The average person in Mississippi generates 5 pounds of solid waste per day, above the national average of 4.5 to 4.9 pounds per person per day. Fortunately, Mississippi’s landfills have 42 years of remaining capacity on average, although five individual facilities have less than 20 years and require more immediate expansion. These expansions are being pursued to ensure continued adequate disposal capacity statewide. Mississippi Department of Environmental Quality (MDEQ) has seen a substantial downward trend in violations and fines over the past 20 years, indicating the state is trending in the right direction for protecting public health. One area of potential improvement lies in recycling. Just 5% of the waste generated in Mississippi is diverted to recycling, compared with approximately 35% of municipal solid waste nationally.
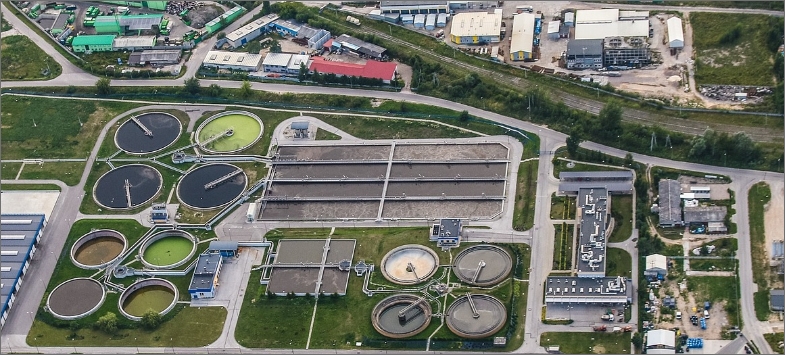
Wastewater
Mississippi has a widely dispersed population, with more than 50% of its residents living in rural areas. As such, approximately 40% of Mississippians (nearly 400,000 households) use onsite wastewater treatment such as septic systems. The remaining residents are connected to a nearby sanitary sewer system where their household sewage is collected and transported to a wastewater plant for treatment. Insufficient funds to cover plant operation and maintenance expenses and there exists a $2 billion backlog in needed repairs or upgrades. That increases the possibility of wastewater leaks into the environment, endangering the public. While some utilities are raising rates to meet budget deficits, much of the state’s wastewater infrastructure is heavily dependent on federal funding; new approaches to closing the budget gap and financing wastewater improvements, particularly O&M and upgrades, should be considered. As the state’s population remains stable, threats from increasing wet weather conditions, inconsistent maintenance, and a lack of rehabilitation pose extreme threats to the state’s wastewater infrastructure.
67% of the transmission and 37% of the distribution systems constructed before 1970.
State Fact Sheet
Download Fact Sheet
16,711
Bridges
6%
of Bridges are Deficient

347
High Hazard Dams

$20.3B
in Drinking Water Needs

881 Miles
of Levees
Protecting 282,000 people

56%
of Roads in poor or fair condition

$ 1,086
Motorist pays annually
due to insufficient infrastructure
3.2M
Passenger Trips on Public Transit
$10.5B
Wastewater needs

$86.8B
Total storm damage
(1980-2024)

IIJA Grants
IIJA Funding Announced
Number of IIJA Projects
Amtrak Gulf Coast Region Improvements: This $178 million award will upgrade tracks, signals, grade crossings, and stations along a key Gulf Coast rail corridor, resulting in improved safety, reliability, and passenger experience.
I-10 Widening in Harrison and Hancock: This $60 million award will widen I-10 in Harrison and Hancock Counties, resulting in improved efficiency and capacity along a major freight corridor of regional significance.
Mississippi Barrier Islands Restoration: This $77 million award will restore the Mississippi barrier islands, resulting in increased storm resilience, reduced saltwater intrusion and shoreline erosion, and strengthened tourism opportunities.
Connect with Your Legislators
Let everyone know how important it is that we continue to invest in the future of America’s infrastructure.
Take Action Today