The national transportation research group TRIP released a new report on October 17, 2018 identifying the urban areas with the roughest roads and highest costs for drivers across the country. “Bumpy Roads Ahead: America’s Roughest Rides and Strategies to make our Roads Smoother” found that one third of the nation’s major urban roads are in substandard condition and these rough roads were costing the average driver $599 annually.
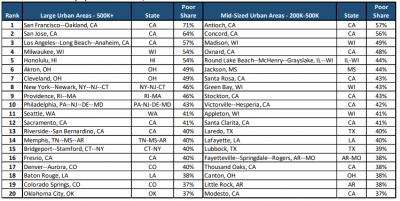
California drivers are contending with the worst urban pavement conditions. Seventy-one percent of roads in the San Francisco-Oakland Area are in poor condition, costing drivers an average of $1,049 in vehicle operating costs each year. The other major metropolitan areas in California did not fare much better; San Jose was ranked second worst, with 65% of roads in poor condition and costing $983, while the LA -Long Beach-Anaheim region came in third with 57% of roads in poor condition, for a cost of $921 in annual vehicle operating costs. Milwaukee, Wisconsin and Honoloulu, Hawaii rounded out the top five, with 54% of roads in both cities in poor condition.
 TRIP’s report also notes that vehicle travel rates have returned to pre-recession levels and large truck travel is forecasted to grow. Both trends are impacting road condition by accelerating the rate of pavement decline. Large commercial truck travel increased 29% from 2000 to 2016, and forecasts show travel will increase by approximately 56% by the year 2045.
Increasing traffic volumes are an indication of the strength of the economy, but the lack of adequate funding for road repairs can hamper productivity. “Rough Roads” also draws on the United States Department of Transportation finding that the current backlog in needed road and highway rehabilitation totals $419.5 billion. The substantial gap between what we need to invest in our surface transportation infrastructure and what we are actually investing is explored in ASCE’s 2017 Infrastructure Report Card.