
2017 New Hampshire Infrastructure Report Card
2017 Report Card GPA: C-
Infrastructure is the backbone of our community. While we don’t always acknowledge it, the condition of our infrastructure has a very real impact on our lives. We all depend on roads and bridges to get us where we are going, water infrastructure that delivers clean on-demand water, electricity to light our home and office, and schools that will facilitate a learning environment. Historically, our country’s large infrastructure investments have been reactionary measures to the national and world economic and current events, and generally between these major events our investment are inadequate to meet our needs. Many of our infrastructure systems are struggling to stay in adequate condition, and as these systems continue to surpass their intended lifecycles, New Hampshire residents and policymakers must decide if we value the personal and economic advantages that come from a robust infrastructure network, and if we do, to make it a priority moving forward.
This Report was created to help New Hampshire understand the state of our infrastructure. As civil engineers, our job is to plan, design, construct, and maintain our infrastructure networks, and the ASCE-NH 2017 Report Card provides an opportunity to share that information with the public. This document is a snapshot for residents and policymakers to engage in conversation about where we are and where we want to be. We hope that this information provides the insight needed to start that conversation. The grades and summaries of what was found are listed below.
To read the executive summary of the report, click here.

-
Explore New Hampshire
- Grades
- State Fact Sheet
- IIJA Grants
New Hampshire Infrastructure Grades
A: Exceptional, B: Good, C: Mediocre, D: Poor, F: Failing
Each category was evaluated on the basis of capacity, condition, funding, future need, operation and maintenance, public safety, resilience, and innovation
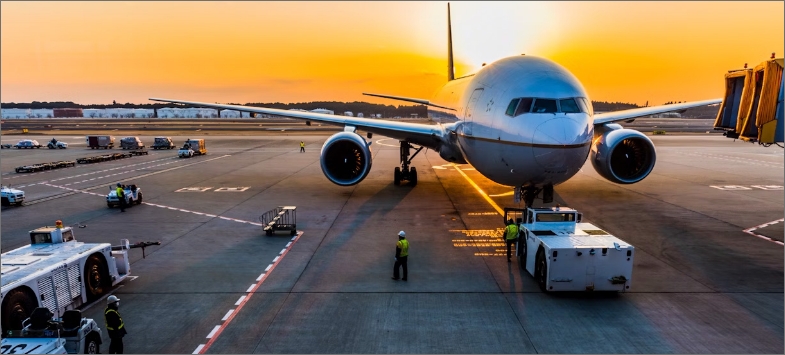

Aviation
The New Hampshire airport system has undergone notable safety improvements over the last 5 years however funding for future airport infrastructure improvements remains too low and uncertain. There are currently a total of 107 registered airports, heliports, and seaplane bases in New Hampshire, of which 25 are open to the public and 12 are “system airports” that are eligible for federal funding on an annual basis. New Hampshire’s airports serve varying purposes, and experience varied levels of activity. Future improvements are planned with an emphasis on continued safety improvements, improved flying facilities and airport accessibility, and a focus on economic return on investment.
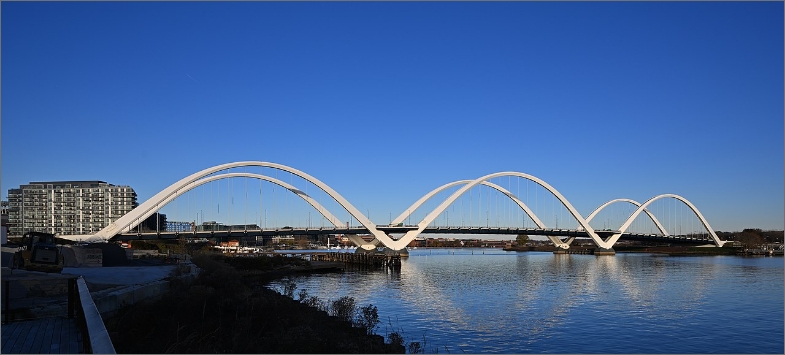
Bridges
There are 3,848 bridges in the New Hampshire Department of Transportation (NHDOT) bridge inventory with an approximate replacement value of $8 billion. Nearly 80% of all state-owned bridges were constructed prior to 1980, over 650 of those bridges are over 75 years of age, and between 2010 and 2015 the average age of state-owned bridges increased from 52 to 56 years. A typical bridge design life is 50 years, and therefore, the average bridge in New Hampshire now has reached or exceeded its planned functional life. As of December 2015, 12.8% of the bridges in state were considered structurally deficient, corresponding to 9.2% of the total bridge deck area. Due to the average increasing age of state-owned bridge structures, it is anticipated there will be an upward trend in number of state-owned “Red List” bridges. “Red List” bridges require more frequent inspections due to poor condition, weight restrictions or construction type, and also require more funds to maintain.
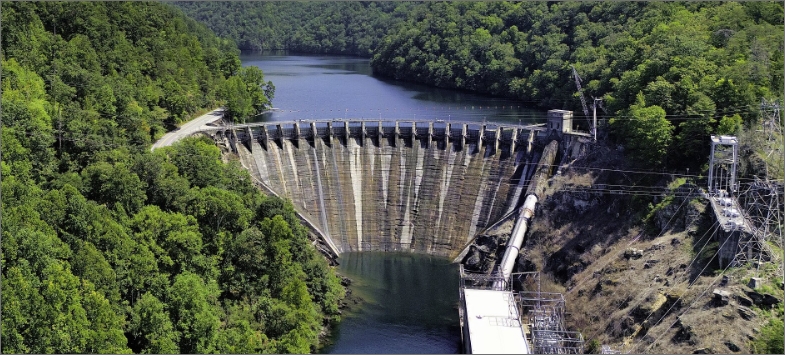
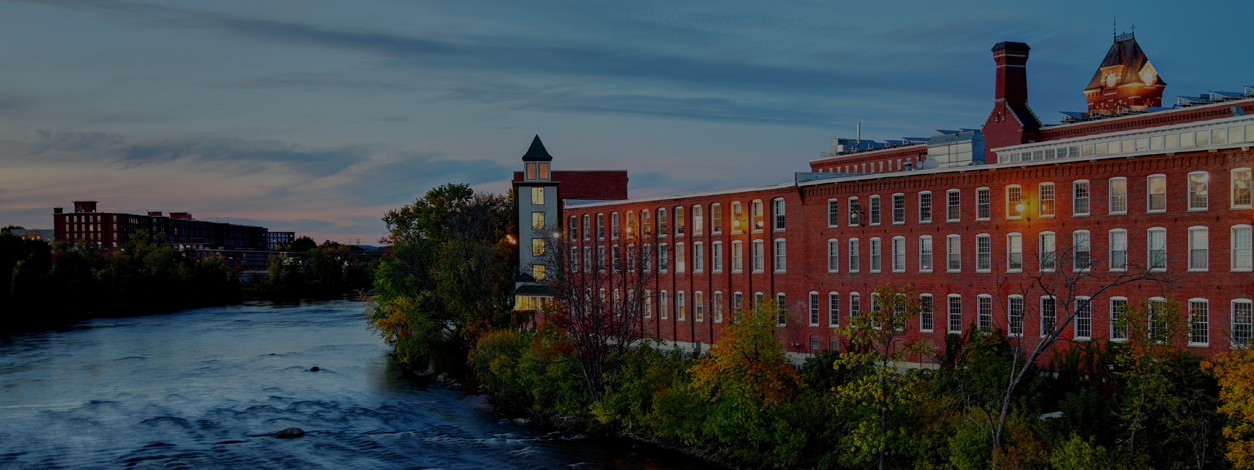
Dams
Dams are an important feature of the New Hampshire environment, creating some of the best water-based recreational areas in the state, providing water supply and hydropower, and, in a few cases, flood control. However, dams that are not maintained in good operational order can fail and cause loss of life and economic damage. A number of the dams in the state, particularly those on the large lakes, were constructed in the mid-1800s to provide waterpower to fuel the great Industrial Revolution-era mills of New Hampshire and Massachusetts. In New Hampshire, the risks associated with many dams are increasing because of: 1) the increasing age of the inventory of dams in the state (the average age of the dams in New Hampshire is 87 years; 2) the number that were built before dam safety engineering standards were developed (over 60% of the dams were built before 1960); 3) businesses and homes that have been built downstream from dams in areas that would be flooded if the dams were to fail; 4) the increasingly frequent occurrence of extreme rainfall events due to climate change; and 5) the lack of needed/required maintenance on many privately owned and some publicly owned dams.
New Hampshire has 146 High Hazard Dams, 158 Significant Hazard Dams, and 532 Low Hazard Dams. 138 of the 146 High Hazard Dams have Emergency Action Plans (EAPs), which show the area that would be inundated if the dam were to fail, and provide a notification flow chart and procedures to be followed by the dam owner during an incident which could threaten life and property downstream. The remaining High Hazard dams have been recently upgraded and the EAPs are in progress. Based on the most recent inspections of the High Hazard Dams, 44 are rated as in Satisfactory Condition, 36 are rated as Fair, 37 are rated as Poor, 2 are rated as Unsatisfactory, and 27 have not yet been rated.

Drinking Water
The public drinking water infrastructure has served NH communities and businesses well over the past several decades. However, much of the current infrastructure has exceeded its design life, is operating at its capacity, or is out of compliance with new regulatory standards and requires upgrading or replacement. In many cases, the actual condition of the infrastructure is unknown because it is buried underground. Accurate records and locations of the infrastructure are also sometimes unknown due to the age of the infrastructure.
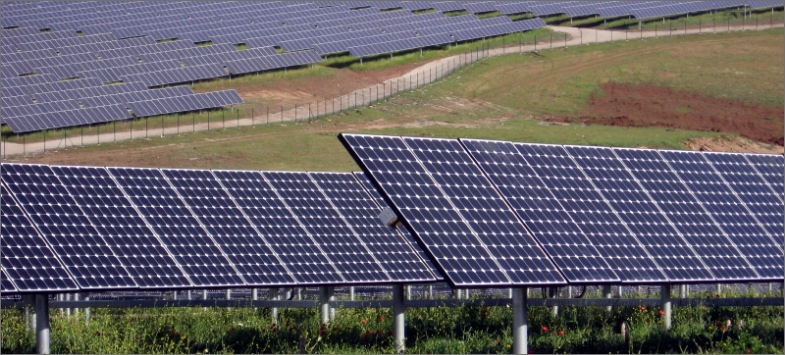
Energy
Significant investments have been made to improve the reliability of New Hampshire’s electrical transmission and distribution systems and upgrade existing gas distribution infrastructure. However, retirements of power generators in the region are expected to result in demand outstripping the supply of electricity by 2018 unless new generators are added or efficiency reduces demand. Currently, nuclear and natural gas generation make up 80% of New Hampshire’s generation capacity with the remaining 20% made up of coal, hydroelectric and renewables. The reliability of supply, lack of diversity, and age of energy infrastructure increases our state’s and customers’ risk for future increased energy costs. In 2016, the average price of electricity in the state increased over 2015 prices, and electricity rates are higher in New England than anywhere else in the contiguous US, however, the average bill of a commercial entity in New England is significantly lower than the average commercial bill in the US.

Hazardous Waste
New Hampshire, like many of the states in the northeast, has a wide range of environmental legacy concerns due to the industrial and manufacturing past of the state. There are currently over 1,649 sites that must address petroleum and/or hazardous waste contamination according to inventories maintained by the New Hampshire Department of Environmental Services (NHDES). In addition, there are 20 Superfund sites and 600+ Brownfields in New Hampshire. Although progress has been made with many sites and the Methyl-tertiary-Butyl Ether (MtBE) Remediation Bureau was formed during 2014 to specifically address state-wide MtBE contamination, overall revenues for contaminated site cleanups have been declining. In March 2016, the Southern New Hampshire perfluorooctanoic acid (PFOA) investigation was launched to identify sources of perfluorochemicals (PFCs) in southern New Hampshire drinking water supplies. This investigation was expanded and, to date, PFCs have been found in several locations within New Hampshire; the investigation is ongoing. The emergence of these new contaminants has further stretched the efforts of the already overloaded NHDES both in terms of department responsiveness and funding for cleanup efforts.
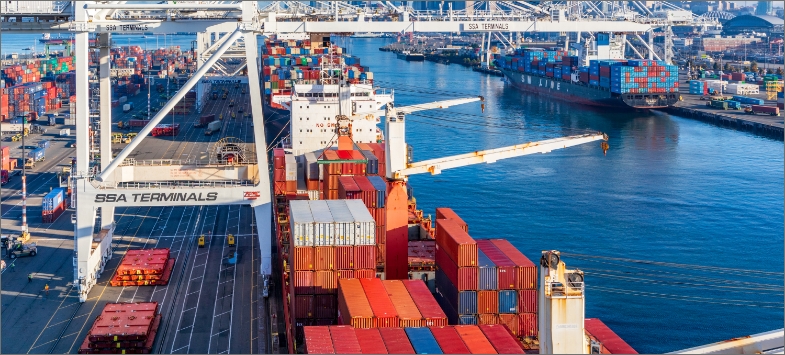
Ports
With only 17 miles of coastline, New Hampshire has a limited number of commercial ports. However, these facilities play a vital role in the economy and recreational activities of the seacoast region. Years of inattention, lack of planning, and deferred maintenance have resulted in substandard conditions that limit the potential of New Hampshire’s ports.
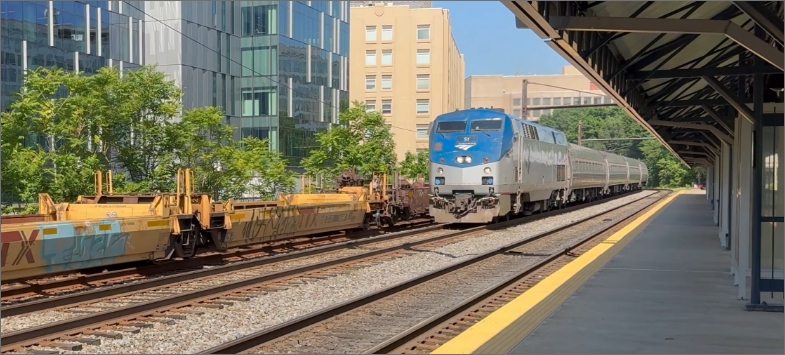
Rail
New Hampshire has a total of 443 route miles of rail trackage as reported in the 2012 State Rail Plan. The state’s rail trackage is used primarily for transporting freight, but the network also includes tourist railroads and Amtrak passenger service operating on selected routes. The State of New Hampshire owns approximately 201 miles of active track (45% of the total in-state trackage) that are leased and operated by private carriers. Approximately 242 route miles are owned and operated by private railroads, with one regional railroad (Pan Am Railways) operating 121 miles of the total trackage.
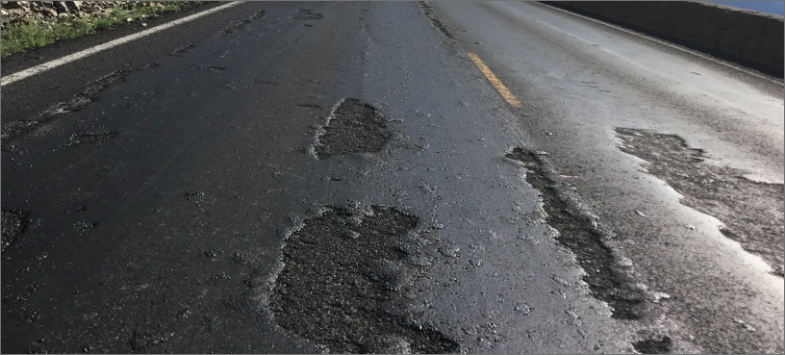
Roads
New Hampshire has seen an increase in vehicle miles traveled (VMT) on the state’s roads since 2011, when the last Report Card was released. Based on the 2015 assessment, approximately 47% of the road network is in good condition, 24% in fair condition, 22% in poor condition and 7% in very poor condition. This includes large investments in the Interstate I-93 corridor and Spaulding Turnpike. New Hampshire passed a 4.2-cent/gallon gas tax increase in 2014, which helps to offset some of the costs from 20 years of deferred investment, however there are still unmet needs. The effectiveness of a gas tax continues to decline as vehicle mileage per gallon and alternative fuel vehicles continue to erode the revenue generated.
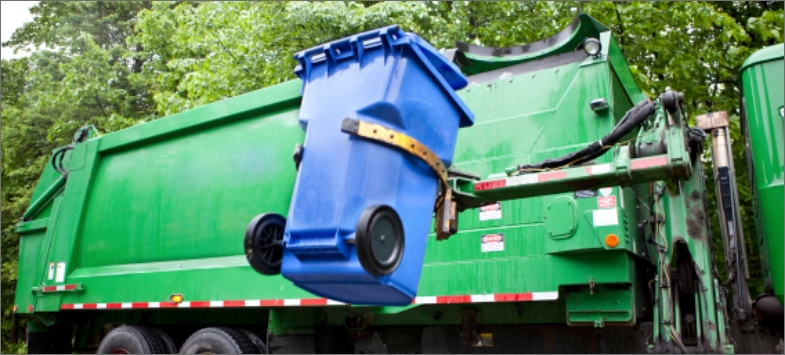
Solid Waste
Most New Hampshire citizens do not pause to consider what happens to solid waste (trash) once it’s picked up or dropped off at the town transfer station. Yet, the proper planning and management of solid waste disposal is essential to the smooth operation of a clean, modern society. Solid waste in New Hampshire is disposed in two privately owned commercial landfills, four publicly owned landfills and one waste to energy facility. The facilities are generally well constructed and properly operated. Landfill operations are challenged to preclude discernable off-site odors. Adequate capacity is available at existing sites to expand the larger current landfills to provide about 20 years of statewide capacity needs. Permitting of the next landfill construction phases at these existing sites needs to proceed over the next several years to assure future capacity. New Hampshire’s recycling rate is 35% compared to a statewide goal of 40%. Single stream recyclables are hauled to neighboring states due to the lack of a single stream processing facility in New Hampshire. Restaurants and some towns in New Hampshire are beginning to segregate food wastes for composting. New Hampshire should consider adopting regulations to encourage the segregation and processing of food wastes and to facilitate the permitting of appropriate processing facilities.

StormWater
The demands on municipal stormwater management continue to increase with aging stormwater infrastructure handling greater flows than they were originally designed for. Stormwater is water from rainfall or snowmelt that flows over the land surface and does not soak into the ground. Stormwater is recognized by the U.S. EPA and New Hampshire environmental agencies as one of the leading causes of water pollution. Increasingly stringent regulations have also placed additional burdens on cities to improve water quality. Investment strategies to implement modern stormwater management are needed at the local level. While the monetary cost of managing stormwater is high, the potential cost of inaction is even higher. Without significantly changing our approach to managing stormwater, the State will likely experience even more extensive flooding and degradation of water resources that will impact drinking water quality, aquatic habitat, recreational opportunities, and tourism.
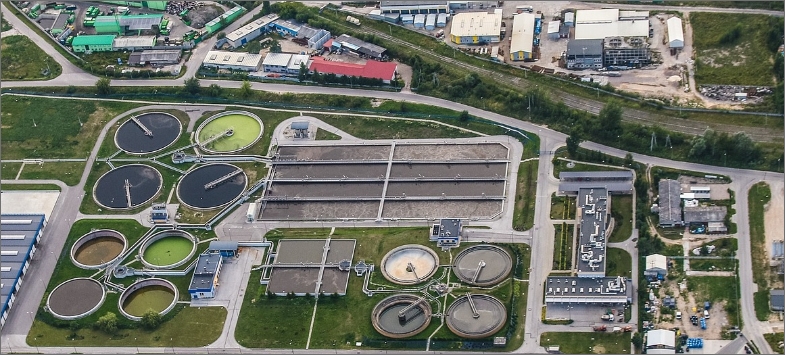
Wastewater
Water is the cornerstone of New Hampshire’s beauty and prosperity. Our beautiful lakes, rivers, and seacoast bring hundreds of thousands of visitors to the state every year. The wise management and protection of our water resources is critical to New Hampshire’s economy, public health, and environment.
The majority of New Hampshire wastewater, about 65%, is treated by private on-site disposal systems generally consisting of a septic tank with a leach field. Approximately 35% of the state’s population is served by 91 public and 30 private wastewater collection/treatment systems. Most of these systems, 71, discharge their treated wastewater to surface waters and the remaining 27 discharge to groundwater. The majority of these systems, 74%, are small by industry standards conveying and treating less than 1.0 million gallons per day.
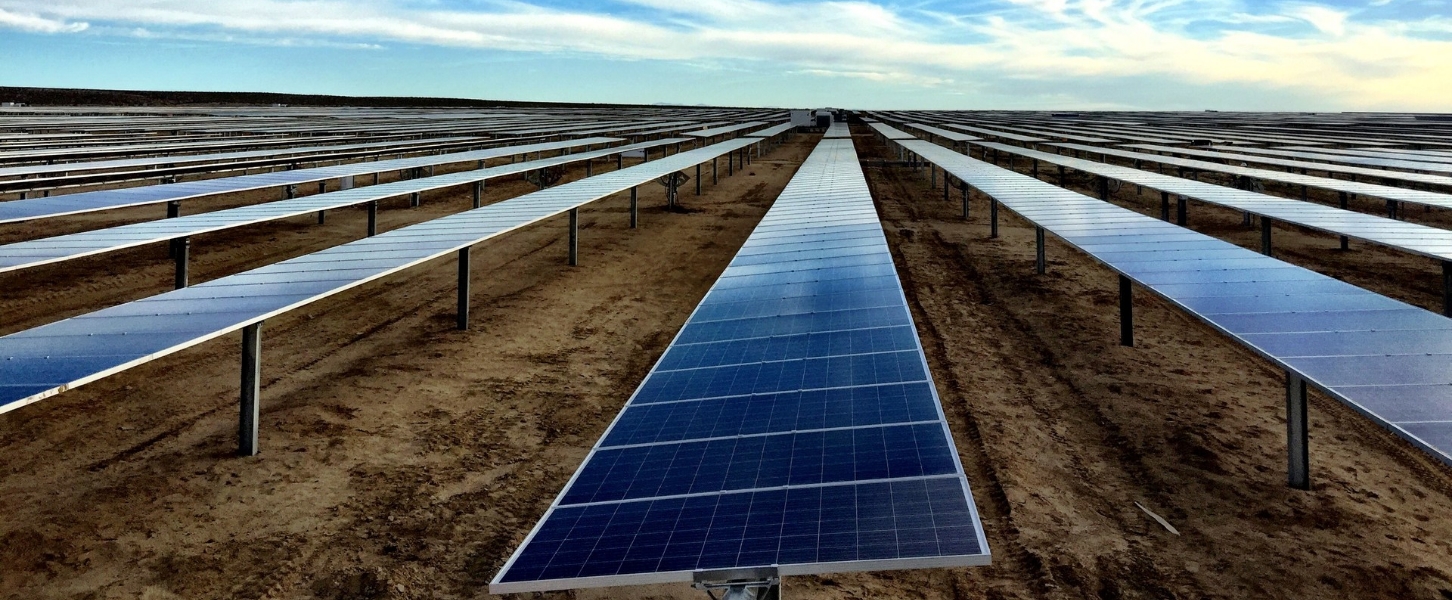
Nuclear and natural gas generation make up 80% of New Hampshire’s generation capacity with the remaining 20% made up of coal, hydroelectric and renewables.
State Fact Sheet
Download Fact Sheet
2,549
Bridges
8%
of Bridges are Deficient

162
High Hazard Dams

$7.1B
in Drinking Water Needs

3 Miles
of Levees
Protecting 417 people

34%
of Roads in poor or fair condition

$ 529.73
Motorist pays annually
due to insufficient infrastructure
3.0M
Passenger Trips on Public Transit
$12.7B
Wastewater needs

$2.3B
Total storm damage
(1980-2024)

IIJA Grants
IIJA Funding Announced
Number of IIJA Projects
General Sullivan Bridge: This $20 million award will replace the General Sullivan Bridge with a new two-girder superstructure, resulting in the reopening of the multi-use path across Little Bay and restoring a vital connection between Newington and Dover.
Manchester Transit Authority Low and No Emission Bus Award: This $20 million award will construct the first transit center in Manchester, replacing the city’s outdated facility and enabling MTA to expand transit services—resulting in a key economic investment that supports the region’s rapid growth.
City of Berlin Capital Improvements: This $19.5 million award will install a snow-melt system and rehabilitate roads, sidewalks, and municipal parking—resulting in reduced maintenance costs and improved accessibility in Downtown Berlin during the winter.
Connect with Your Legislators
Let everyone know how important it is that we continue to invest in the future of America’s infrastructure.
Take Action Today